Link Graph
Visualize your internal links as an interactive map

A feature of the Link Manager plugin for WordPress
Visualize your internal links as an interactive map
A feature of the Link Manager plugin for WordPress
The Link Graph is a feature of Link Manager that draws your site as a network. Each post is a node and each internal link is an arrow between two nodes. Posts that link to each other are pulled close together, so you can see hubs, well-linked topics, and isolated posts in a few seconds.
Tables are good for checking numbers post by post, but they do not show structure. Two posts can have the same number of internal links and still play very different roles. One can be the center of a topic, linked from many related articles, while the other links to several pages but receives no links back.
The Link Graph shows these relationships directly. Groups of nodes close to each other are topics that are well linked together. Large nodes are the pages that receive the most link equity. Nodes at the edges, or nodes with no arrows pointing to them, are posts that need more internal links.
It is useful when you plan topic clusters, after a content migration, or before an SEO audit.
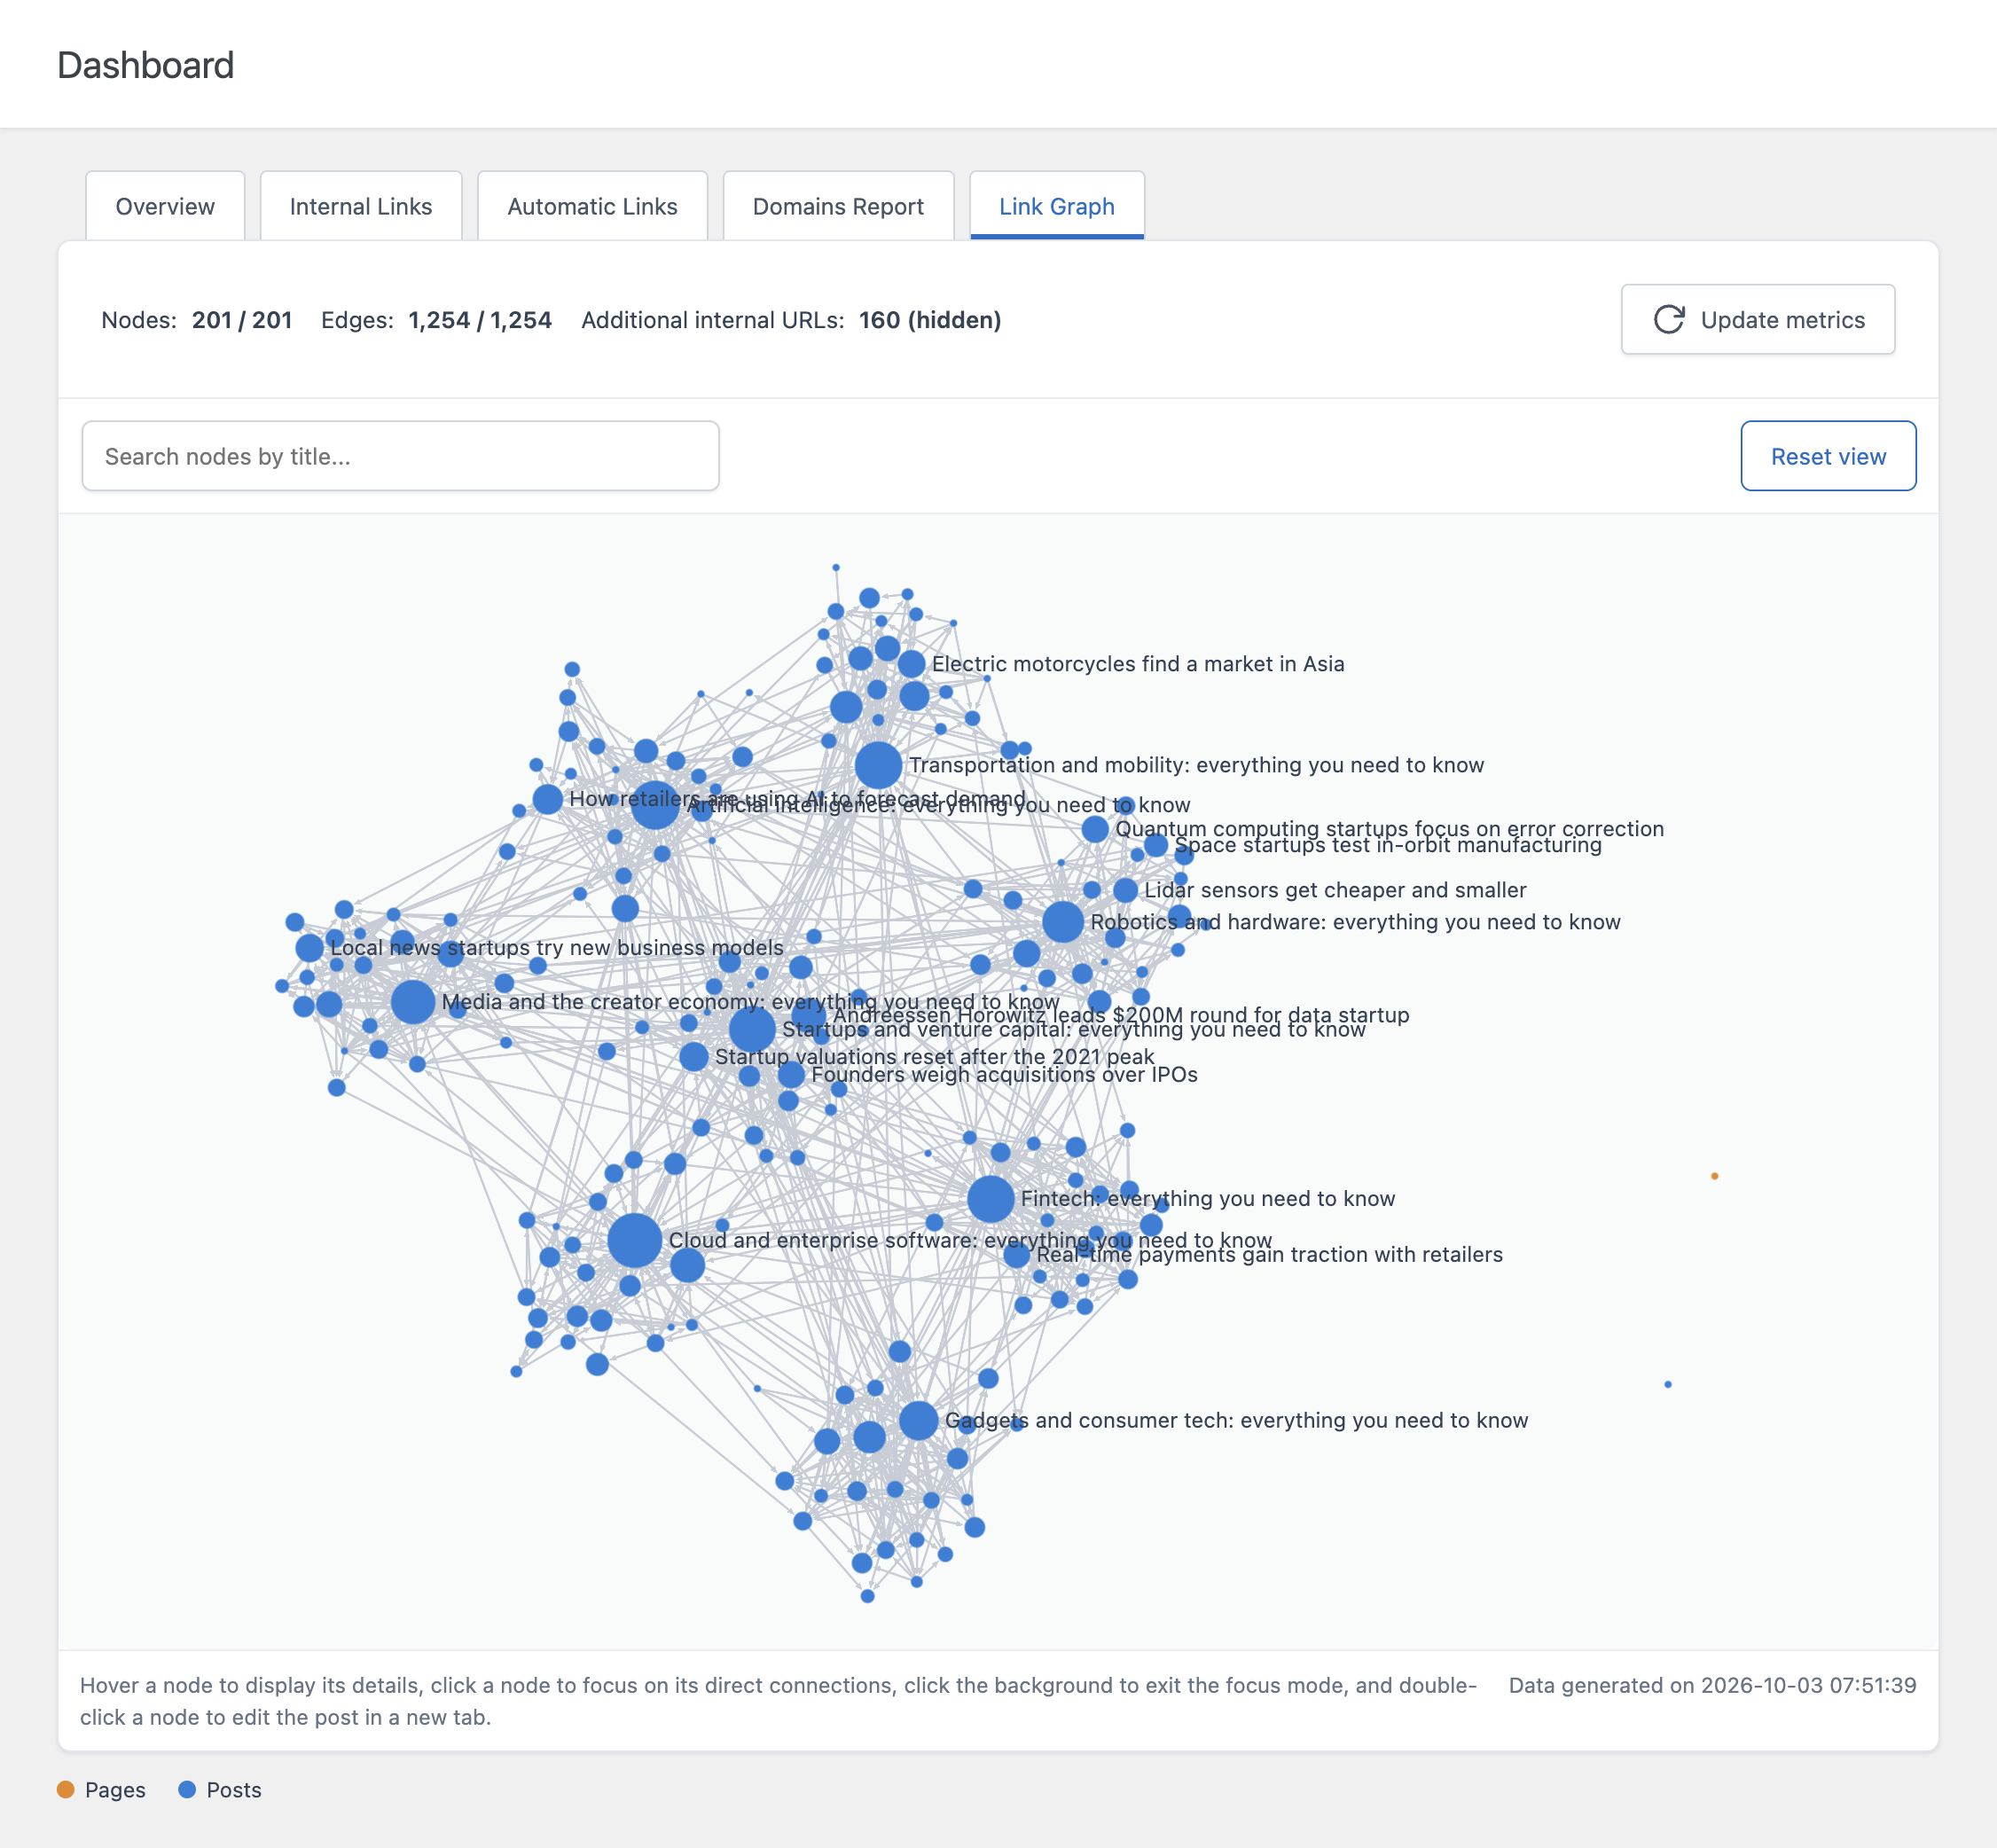
Each published post is a node and each internal link is an arrow from the post that contains the link to the page it points to. When a post links to the same page more than once, the links are combined into a single connection.
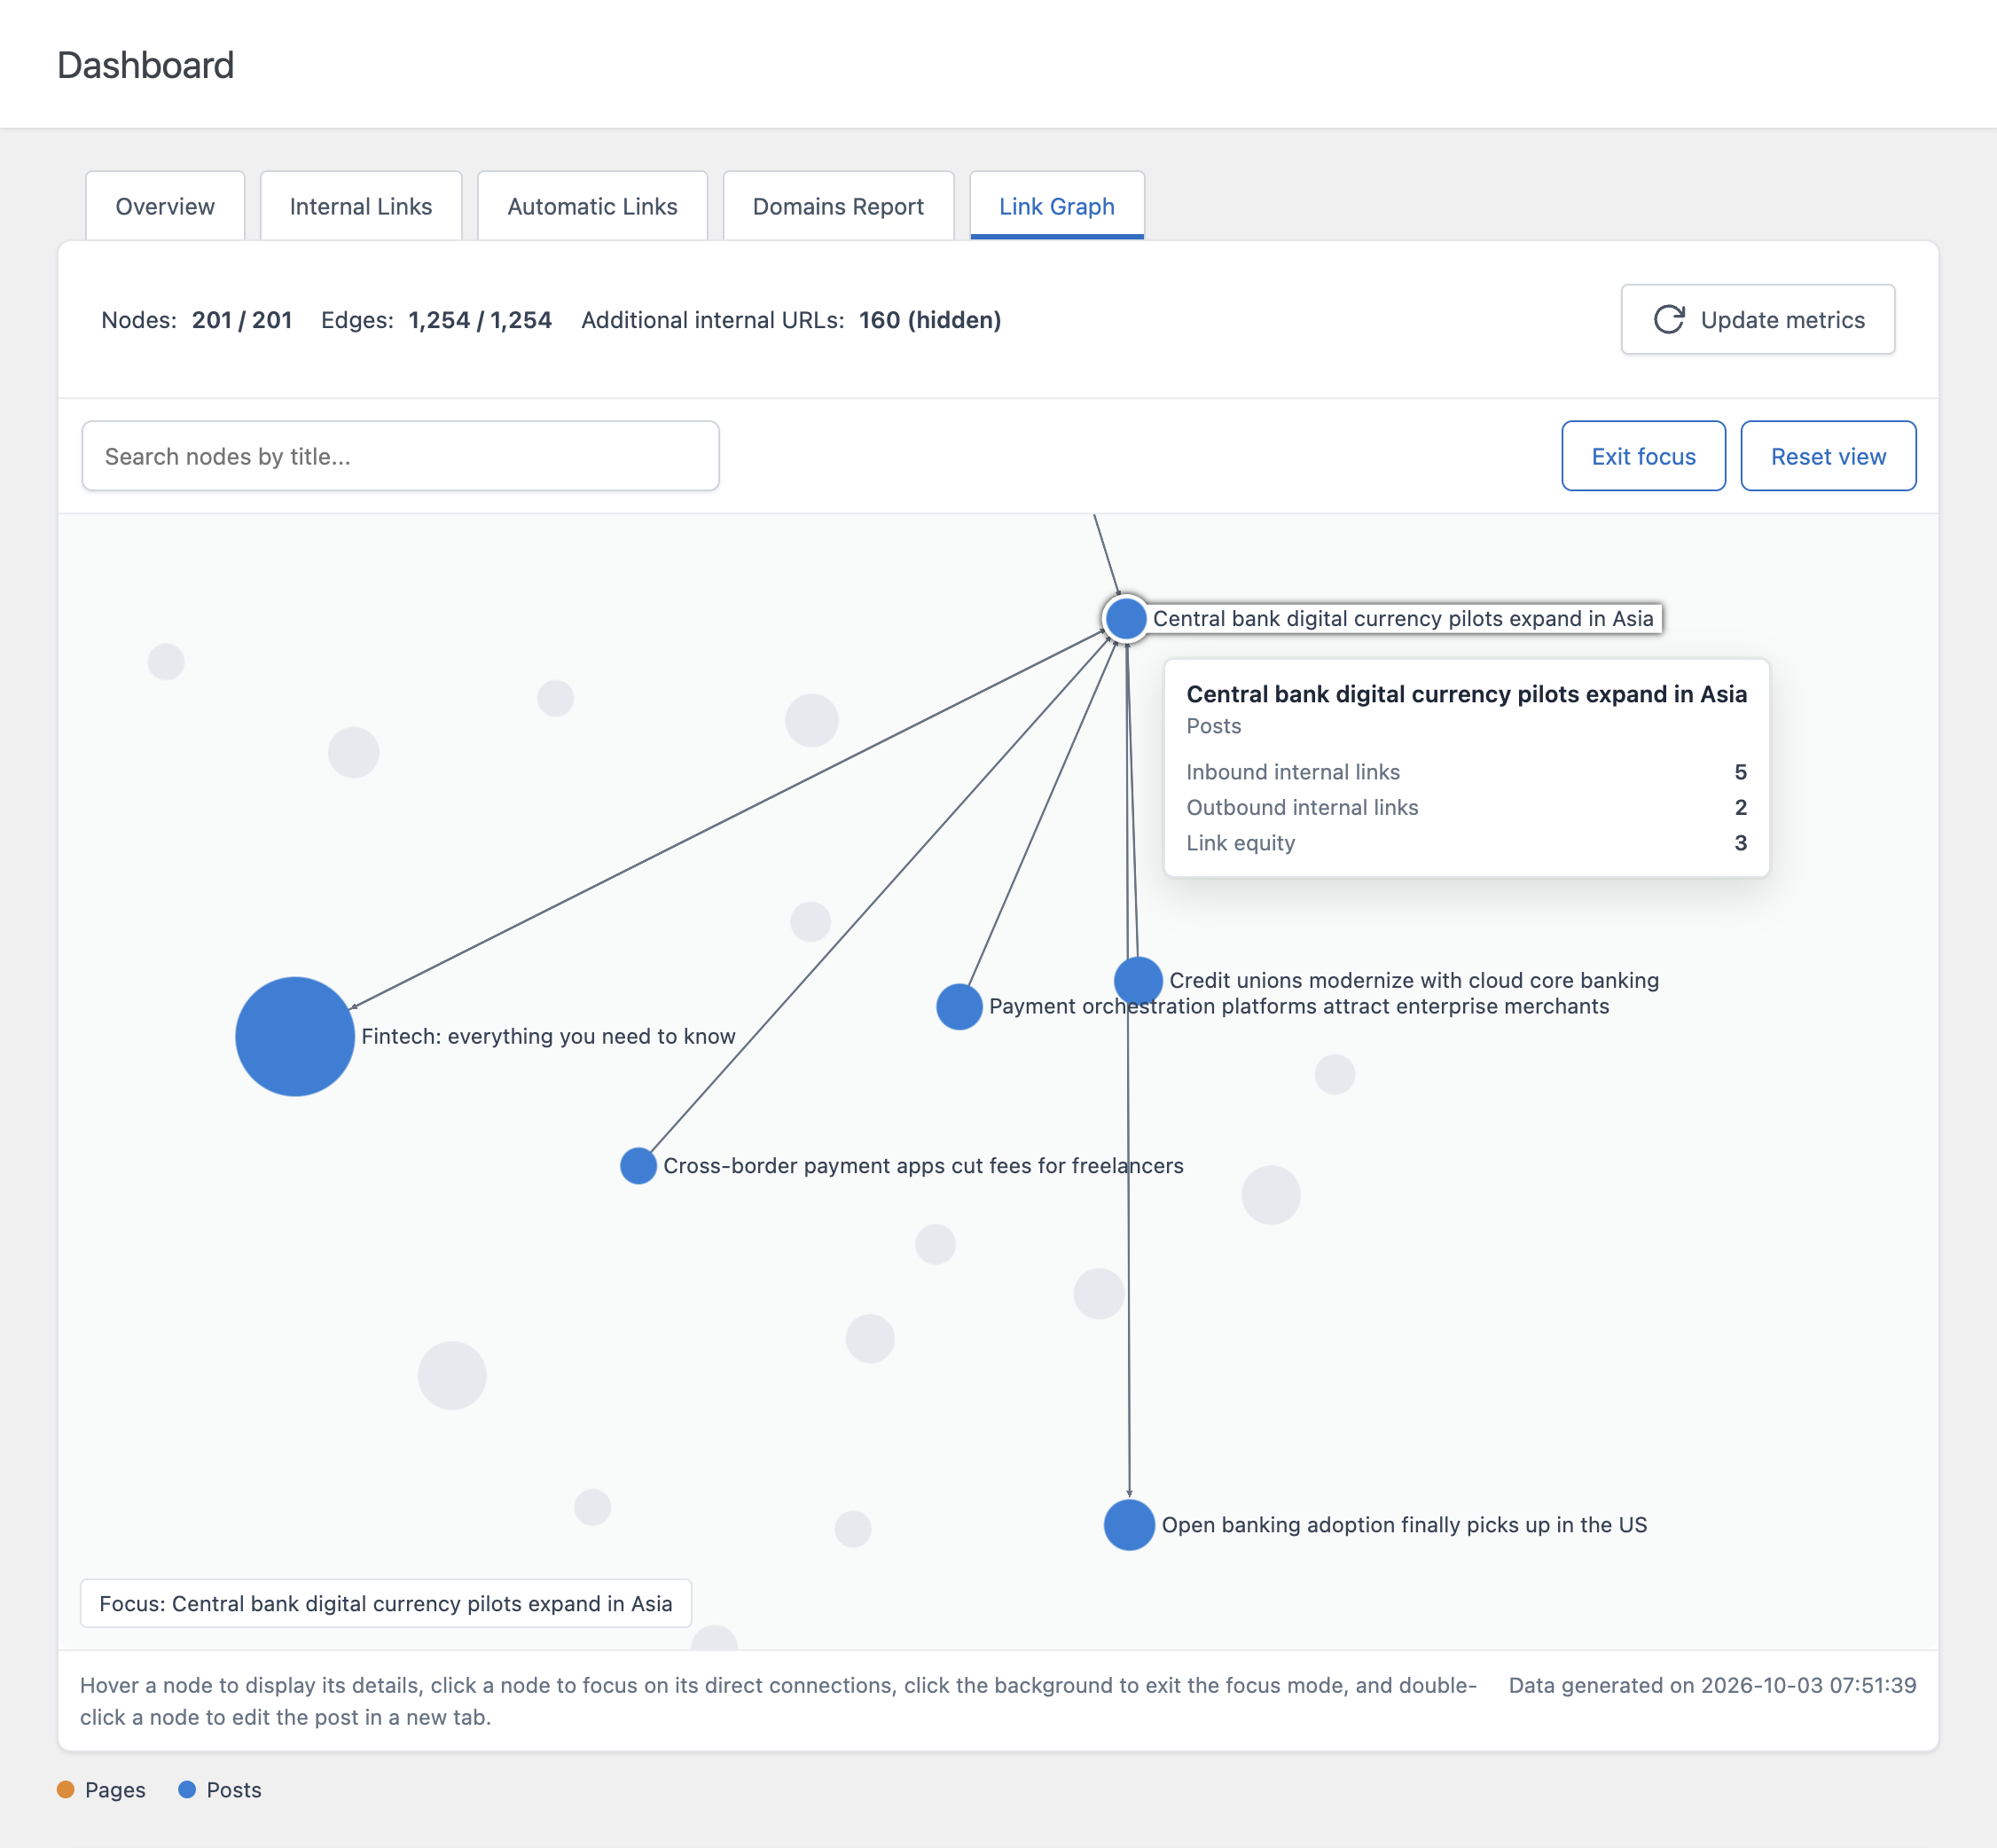
If needed, you can zoom and pan with the mouse or trackpad. Hovering a post shows its post type, inbound internal links, outbound internal links, and link equity.
You can display only internal links, only external links, or both. With external links, the external domains your posts link to appear as additional nodes, so you can see which parts of your site send visitors to other websites. You can also limit the graph to one or more post types, for example to analyze only your blog posts.
Node size can represent link equity, inbound links, or outbound links. By default the size follows link equity, so the most important pages of your site stand out immediately.
Node color can represent the post type or the internal links optimization status. With the optimization status, the graph highlights in a different color the posts that have fewer or more internal links than recommended for their length.
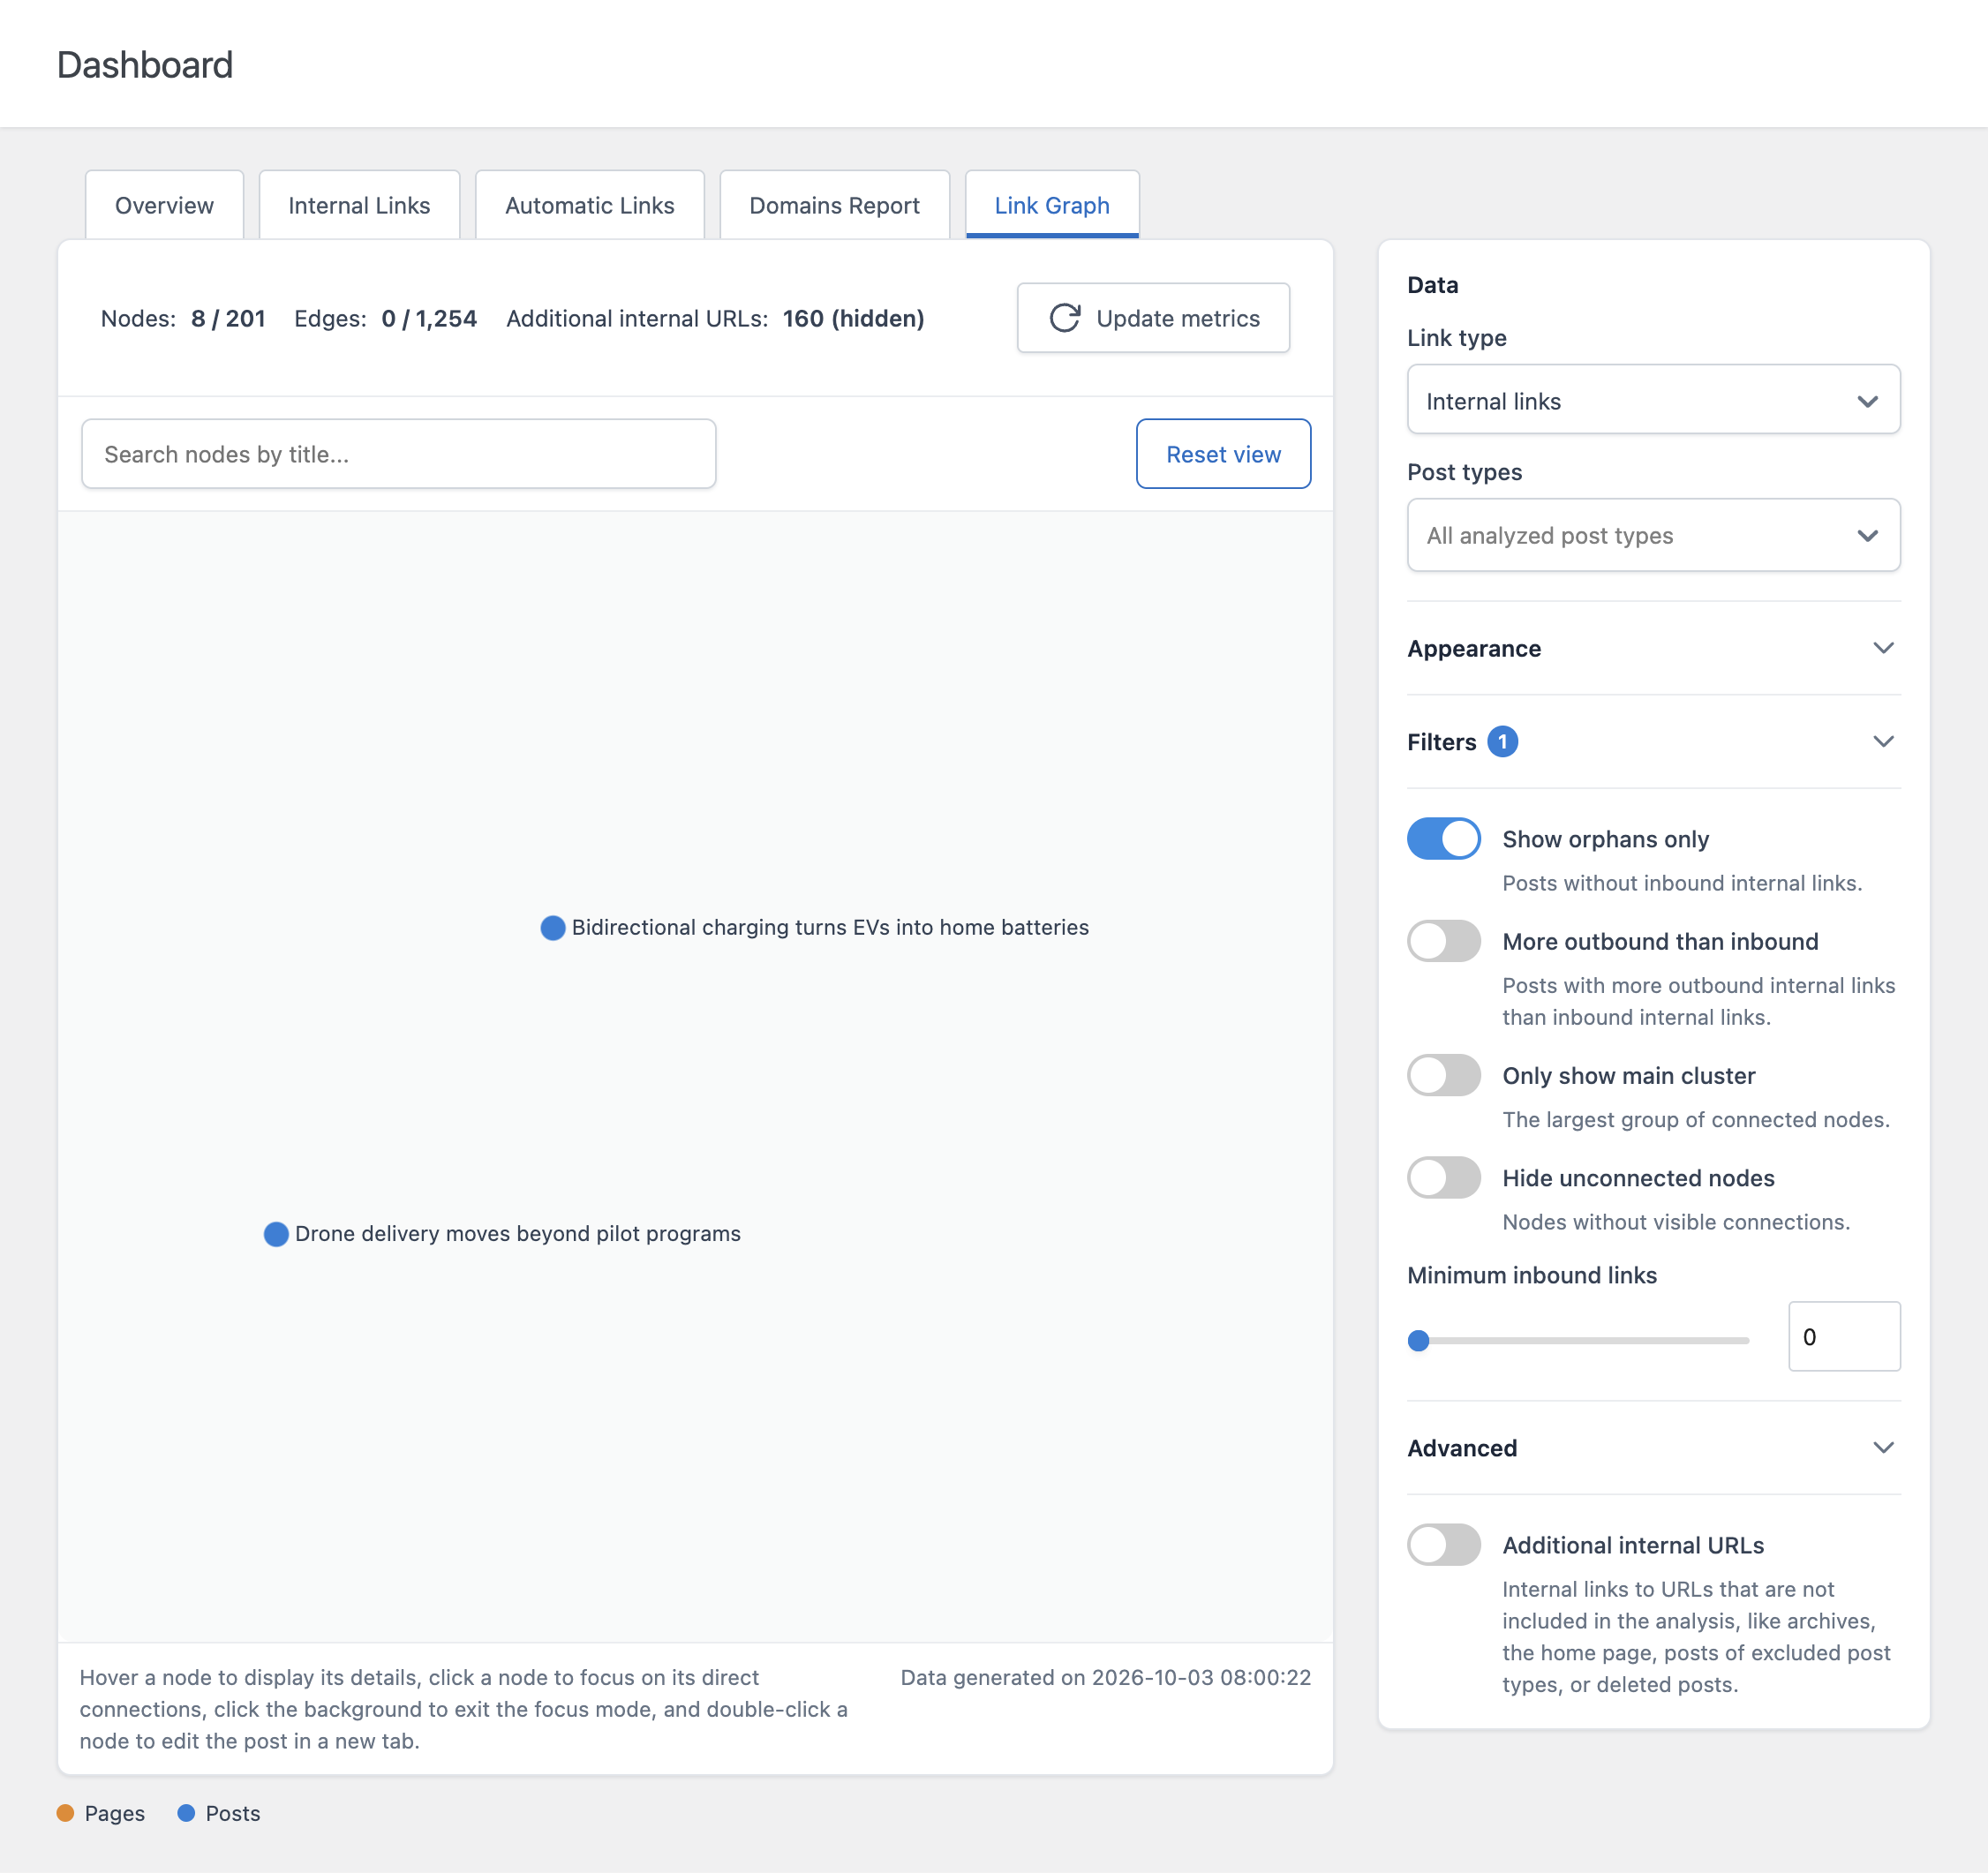
The filters reduce the graph to the posts you need to work on:
You can also limit the graph to one or more post types.
Click a node to enter focus mode. The post and its direct connections stay highlighted while the rest of the graph is dimmed, so you can see exactly which posts link to it and which posts it links to. Double-click a node to open the post in the editor in a new tab. The search field finds a post by title, zooms on it, and enters focus mode.
The Link Graph section of the Settings menu sets the maximum number of nodes displayed and the default link type. When a site has more posts than the limit, the graph keeps the nodes with the highest link equity. The default limit is 5,000 nodes.