

Bar charts are a very common type of chart used primarily to visually compare variables.
A WordPress administrator that needs bar charts in its post has both the option to install a chart plugin or upload images generated with external programs.
Create bar charts with a WordPress plugin
Using a chart plugin gives you many advantages:
- The charts created with a plugin can be interactive and thus have animations, active tooltips, and more
- You can at any time modify the chart if changes are required
- Charts generated with the HTML Canvas or with dynamic SVG are lighter than charts uploaded as raster images
- You have a unique and centralized menu to handle all the charts of the website
This tutorial will use UberChart, a premium WordPress plugin based on the Chart.js JavaScript library, to create all the bar charts.
The UberChart plugin can easily generate all the variations of a bar chart:
- Vertical Bar Chart
- Horizontal Bar Chart
- Vertical Grouped Bar Chart
- Horizontal Grouped Bar Chart
- Vertical Stacked Bar Chart
- Horizontal Stacked Bar Chart
- Vertical Histogram
- Horizontal Histogram
Bar chart
This section covers the simplest type of bar chart.
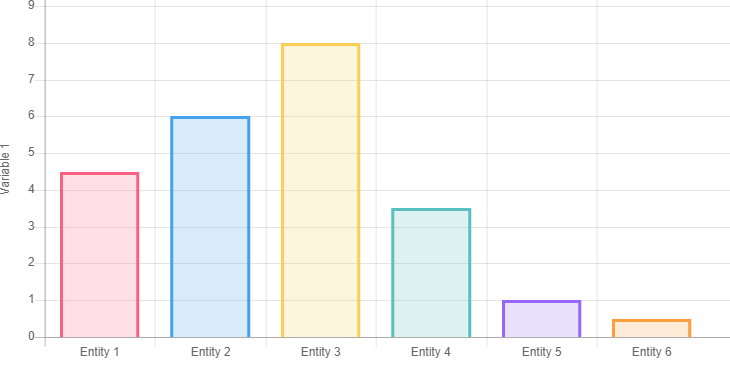
Vertical bar chart
To create a vertical bar chart, proceed as follows:
- Visit the Charts menu
- Load the “Bar chart with a single dataset” model
- Set your data points in the data spreadsheet editor
- Save the chart
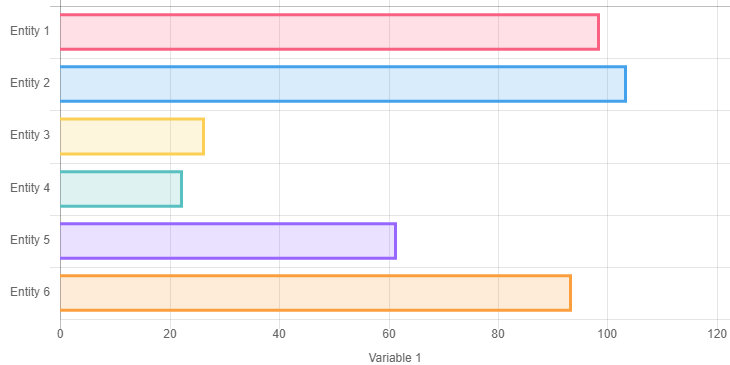
Horizontal Bar Chart
To create a horizontal bar chart, proceed as follows:
- Visit the Charts menu
- Load the “Horizontal bar chart with a single dataset” model
- Set your data points in the data spreadsheet editor
- Save the chart
Grouped Bar Chart
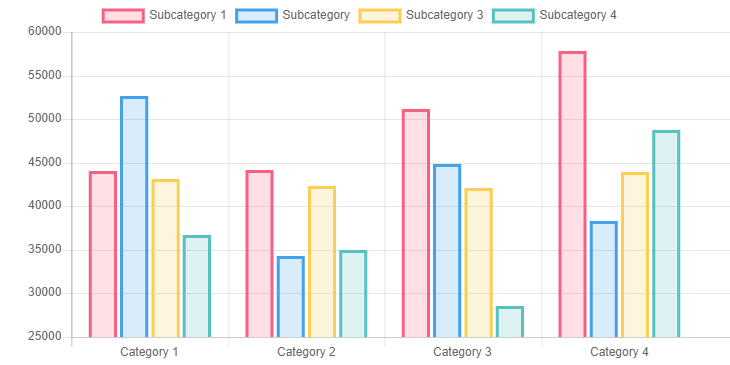
When each category of the bar chart can be split into multiple subcategories, or when the primary category represents a time interval, grouped bar charts can be used.
Vertical Grouped Bar Chart
To create a vertical grouped bar chart, proceed as follows:
- Visit the Charts menu
- Load the “Bar chart with a single dataset” model
- Increase the number of datasets to more than one with the Rows field
- Set your data points in the data spreadsheet editor
- Save the chart
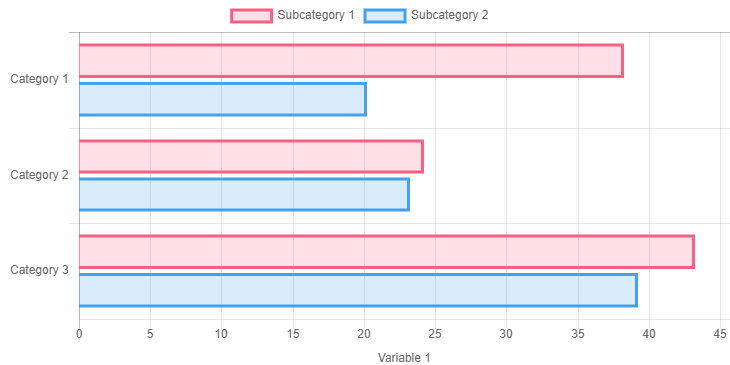
Horizontal Grouped Bar Chart
To create a horizontal grouped bar chart, proceed as follows:
- Visit the Charts menu
- Load the “Horizontal bar chart with multiple datasets” model
- Set your data points in the data spreadsheet editor
- Save the chart
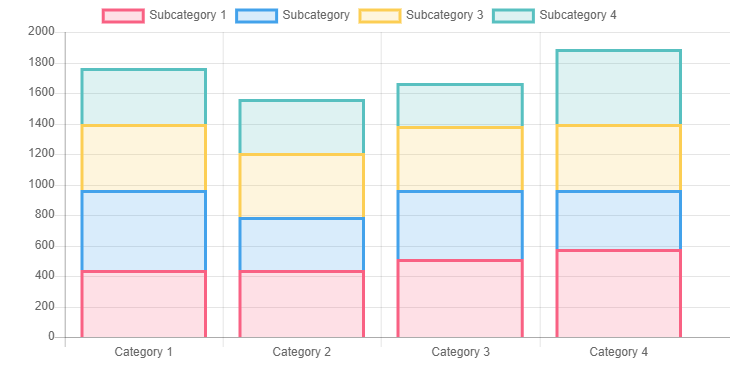
Stacked Bar Chart
A stacked bar chart is recommended when each category of a bar chart can be divided into multiple parts that form a total.
Vertical Stacked Bar Chart
Use this procedure to create a vertical stacked bar chart:
- Visit the Charts menu
- Load the “Bar chart with multiple stacked datasets” model
- Set your data points in the data spreadsheet editor
- Save the chart
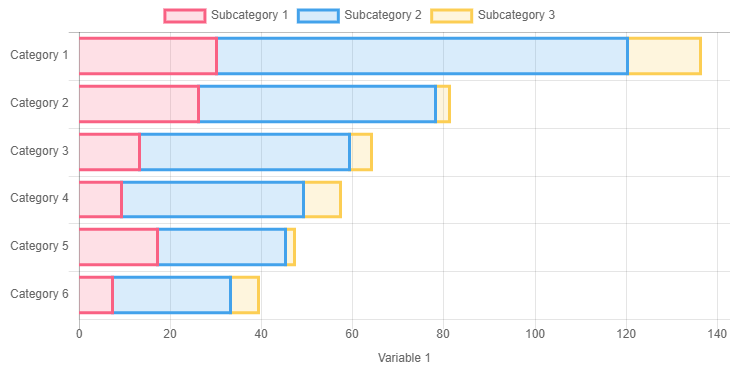
Horizontal Stacked Bar Chart
Use this procedure to create a horizontal stacked bar chart:
- Visit the Charts menu
- Load the “Horizontal bar chart with multiple stacked datasets” model
- Set your data points in the data spreadsheet editor
- Save the chart
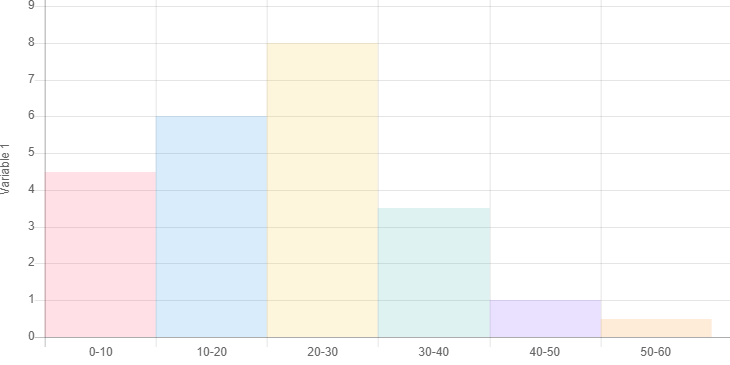
Histogram
Histograms are used to represent the distribution of the same variable visually. In a histogram, the categories are numerical ranges, and the space used to separate the bars of a bar chart is not present.
Vertical Histogram
Create a vertical histogram with this procedure:
- Visit the Charts menu
- Load the “Bar chart with a single dataset” model
- Set the categories with numerical ranges in the spreadsheet editor
- Set your data points in the data spreadsheet editor
- Set the X Scale Options -> Category Percentage and the X Scale Options -> Bar Percentage option to “1”
- Set the Border Width and the Hover Border Width of the dataset to “0”
- Save the chart
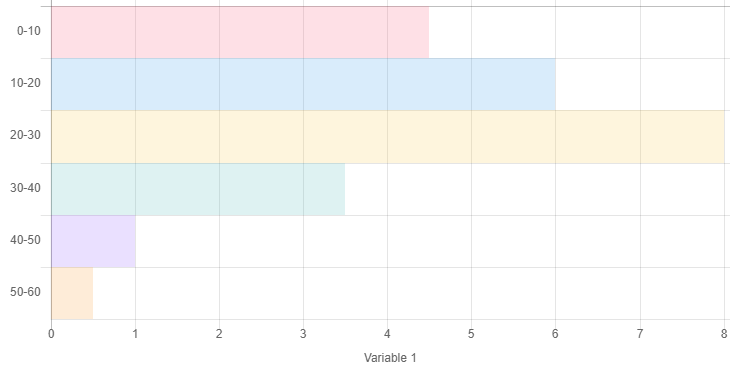
Horizontal histogram
Create a horizontal histogram with this procedure:
- Visit the Charts menu
- Load the “Horizontal bar chart with a single dataset” model
- Set the categories with numerical ranges in the spreadsheet editor
- Set your data points in the data spreadsheet editor
- Set the Y Scale Options -> Category Percentage and the Y Scale Options -> Bar Percentage option to “1”
- Set the Border Width and the Hover Border Width of the dataset to “0”
- Save the chart
Create bar charts without a WordPress plugin
If your idea is to display bar charts in your WordPress posts without using a chart plugin, this is a straightforward method:
- Generate the images of your bar charts with a spreadsheet editor or with a specialized program
- Copy the chart object (or take a screenshot if you can’t copy the chart object to the clipboard)
- Paste the clipboard to a raster graphics editor like Photoshop or GIMP and do your editing if needed
- Save the image in your local storage in a raster format suitable for the web (I recommend the .png file format)
- Add the Image block in the post and upload your image