

This post will guide you in creating radar charts for your WordPress website.
We will be completing this task with three different methods. The first method consists of using a chart plugin, specifically the UberChart plugin. With the second method, a chart will be generated from an external program as a raster image and then uploaded to WordPress. The last way is for developers and consists of creating a chart plugin from scratch.
Create radar charts with the UberChart plugin
UberChart is a premium chart plugin based on the Chart.js JavaScript library that can plot ten chart types, including radar charts.
With UberChart, you can create charts by manually configuring the options or by loading ready-to-use chart configurations named “models”. In this tutorial, we will use the latter option.
For the radar chart, the following models are available:
- Radar chart with a single dataset
- Radar chart with multiple dataset
- Radar area chart with a single dataset
- Radar area chart with multiple datasets
If you are wondering what’s the difference between a radar chart and an area radar chart, with an area radar chart, the internal part of the shape created with the data has a fill color.
A practical example
In this example, I’m going to create a radar chart that represents the following six skills of a designer:
- Typography
- Composition
- Photography
- UX Design
- Programming
- Attitude
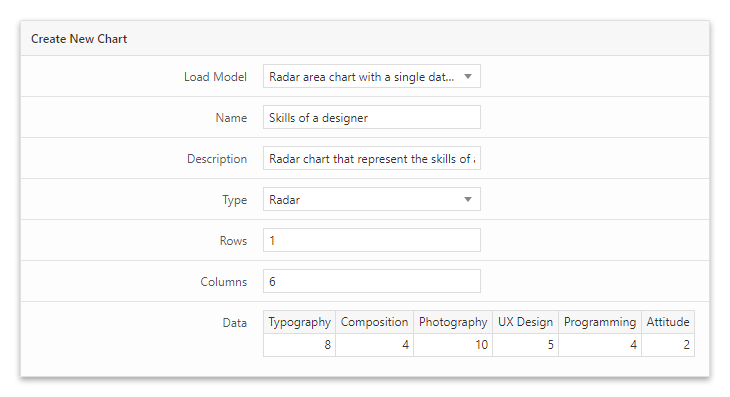
Start with the creation of a chart by loading the “Radar area chart with a single dataset” model. This model prepares a radar chart with a single dataset.
Then add the names of the skills in the spreadsheet header and the corresponding values in the first row of the spreadsheet body.
Open the Preview section to visualize your chart. Note that you can at anytime update this preview with a click on the green refresh button.
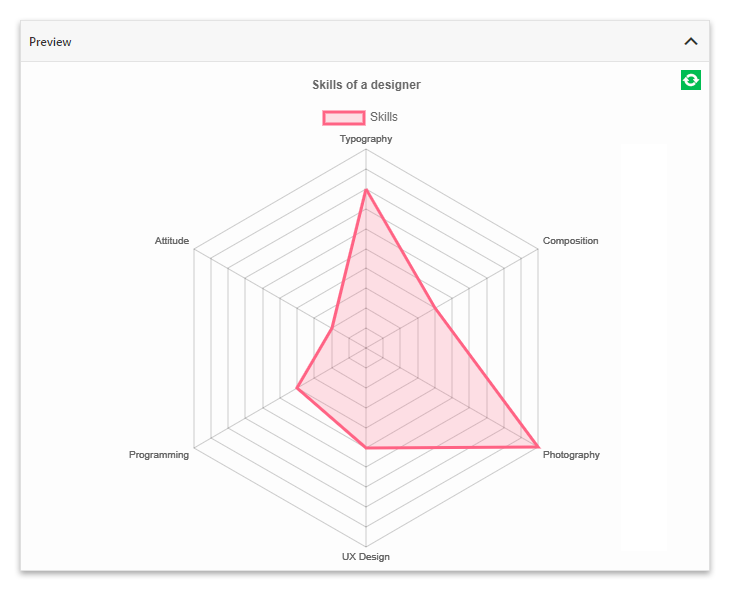
Once you are satisfied with the result, save the chart by clicking the Add Chart button.
Now add your radar chart in the post with the provided shortcode or with the UberChart block. Note that you can place multiple charts in the same article.
Add images of radar charts in the posts
If your use of radar charts in WordPress is limited, you might consider uploading images generated with external programs.
Spreadsheet programs are usually good chart generator. Therefore in the following section, I’ll describe how to create radar charts with the free and open-source spreadsheet editor OpenOffice Calc.
Create a raster image of a radar chart with OpenOffice Calc
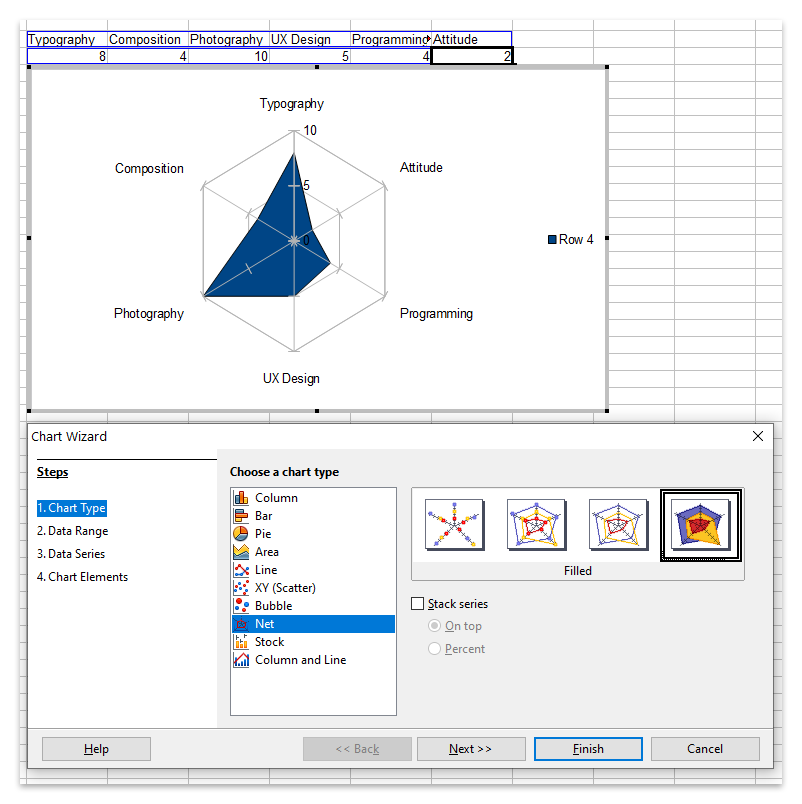
First of all, enter the radar chart data in the spreadsheet editor. Then select the data and click the Chart option available in the Insert menu.
With the Chart Wizard window now opened, select the “Net” chart. Note that you can make the chart similar to the one generated in the previous example by choosing the Filled option.
To conclude, copy a raster image of the radar chart by clicking the Copy context menu option that appears after a right mouse button click on the chart area.
Below you can find the resulting chart. It’s clean and perfectly usable on a website.

Create a custom plugin to include radar charts in your posts
This part of the article targets web developers willing to integrate radar charts in a WordPress website with their custom plugin.
In the following sections, we are going to create two WordPress plugins. The first generates charts with the Charts.js library. The second generates charts with the ApexCharts library.
Create radar charts with the Chart.js JavaScript library
Chart.js is an incredibly popular library (53.6k stars and 10.9k forks on GitHub) that generates animated and responsive charts on the HTML Canvas. It’s a mature and complete project, and a lot of software has been built with it.
The only downside of this library is that it doesn’t produce charts optimized for high-resolution devices like those created with ApexCharts.
How to build the production files
The library downloaded from GitHub doesn’t include the production files. You have to create them by first installing the local dependencies with this command:
npm install
And then by generating the production files with this command:
npm run build
More information on this subject is available on the Building and Testing documentation page of Chart.js.
The PHP part of the plugin
The entire PHP part of a WordPress plugin that plots radar charts with Chart.js is available in the script below. Please pay attention to these critical parts of the script:
- The first part is a declaration used by WordPress to detect the plugin.
- The second part includes hooks used to load two resources in the HTML page. Specifically the Chart.js library and the initialization script that instantiates the chart.
- The third part of the script declares the
[chartjs-chart]shortcode. The plugin converts this shortcode to the canvas element references in the initialization script. Note that this DOM element will be our chart container.
<?php
/*
Plugin Name: ChartJS Radar Chart
*/

function enqueue_scripts() {

    //Load the Chart.js library
    wp_enqueue_script( 'chartjs-library', plugins_url( 'chart.js', __FILE__ ), array(), '3.2.0', true );

    //Our custom Chart.js chart initialization
    wp_enqueue_script( 'chartjs-initialization-script', plugins_url( 'initialization.js', __FILE__ ), array('chartjs-library'), '1.0', true );

}

add_action( 'wp_enqueue_scripts', 'enqueue_scripts' );

//Add a canvas element with a unique id in the post.
function display_chartjs_placeholder(){
    return '<canvas id="chart"></canvas>';
}
add_shortcode( 'chartjs-chart', 'display_chartjs_placeholder' );
The JavaScript part of the plugin
In the plugin JavaScript part, we first declare an object with the radar chart data. The labels property of this object includes the chart labels, and the datasets property includes the datasets of the chart. In this case, there is only one dataset, with the label “Skill”. The internal area of the shape generated with this dataset is filled with the color defined with the fill property set to true.
Then we set a configuration object with the type of chart, the data object previously created, and a series of customization options.
The final two instructions of the script are used to instantiate the chart.
const data = {
  labels: ['Typography', 'Composition', 'Photography', 'UX Design', 'Programming', 'Attitude'],
  datasets: [{
    label: 'Skills',
    data: [8, 4, 10, 5, 4, 2],
    fill: true,
  }]
};

const config = {
  type: 'radar',
  data: data,
  options: {
    elements: {
      line: {
        borderWidth: 3
      }
    }
  },
};

let ctx = document.getElementById("chart").getContext("2d");
let myRadarChart = new Chart(ctx, config);
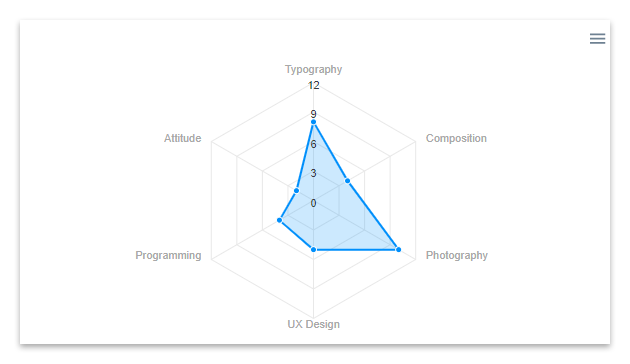
The resulting chart:

Create radar charts with the ApexCharts JavaScript library
ApexCharts plots the charts with dynamic SVG manipulated with the SVG.js library. It’s a great chart library if you a dealing with an application that runs on high-resolution devices or if you need chart types not available in other libraries.
The ApexCharts project doesn’t have the same popularity as Chart.js. However, based on its GitHub statistics, you should still expect significant development and support in the future.
To know more about this library, you might also consider reading this article on creating candlestick charts with ApexCharts.
The PHP part of the plugin
This PHP part is very similar to the one used for the Chart.js plugin. You can find the same three logic parts, namely the plugin declaration, the embedding of the JavaScript assets, and the declaration of a shortcode with its related callback.
Note that in this case, the shortcode doesn’t generate a canvas element, but a div container.
<?php
/*
Plugin Name: ApexCharts Radar Chart
*/

function enqueue_scripts() {

    //ApexCharts library
    wp_enqueue_script( 'apexcharts-library', plugins_url( 'apexcharts.js', __FILE__ ), array(), '1.0', true );

    //Our custom ApexCharts chart initialization
    wp_enqueue_script( 'apexcharts-initialization-script', plugins_url( 'initialization.js', __FILE__ ), array('apexcharts-library'), '1.0', true );

}

add_action( 'wp_enqueue_scripts', 'enqueue_scripts' );

//Display a placeholder in the post.
function display_apexcharts_placeholder(){
    return '<div id="chart"></div>';
}
add_shortcode( 'apexcharts-chart', 'display_apexcharts_placeholder' );
The JavaScript part of the plugin
Here we configure, instantiate and render the radar chart with ApexCharts.
options = {
  chart: {
    type: 'radar'
  },
  series: [
    {
      name: "Skills",
      data: [8, 4, 10, 5, 4, 2]
    }
  ],
  labels: ['Typography', 'Composition', 'Photography', 'UX Design', 'Programming', 'Attitude']
}

let chart = new ApexCharts(document.querySelector("#chart"), options);

chart.render();
Note that ApexCharts adds an optional Hamburger button in the top-right section of the chart area. A click on this button displays three options: Download SVG to download the chart in the SVG format, Download PNG to download the chart in the PNG format, and Download CSV to download the chart data in the CSV format.
Improvements for a real scenario
In a real scenario, I recommend you consider the following enhancements to the radar chart plugins described in this tutorial:
- Use the customization options offered by Chart.js or ApexCharts to create unique and animated charts that perfectly blend with your website.
- Include options to dynamically retrieve the chart data from sources like custom WordPress database tables, files, or external API.
- Replace the shortcode used to generate the chart placeholder with Gutenberg blocks or with elements of other visual editors.