Introduction to the Dashboard
The Dashboard is the central hub of Link Manager. It gives you a complete picture of how links are distributed across your content, how many of them are automatically generated, which posts are under or over-linked, and which external domains your content points to.
The Dashboard is organized into five tabs: Overview, Internal Links, Automatic Links, Domains Report, and Link Graph.
Overview Tab
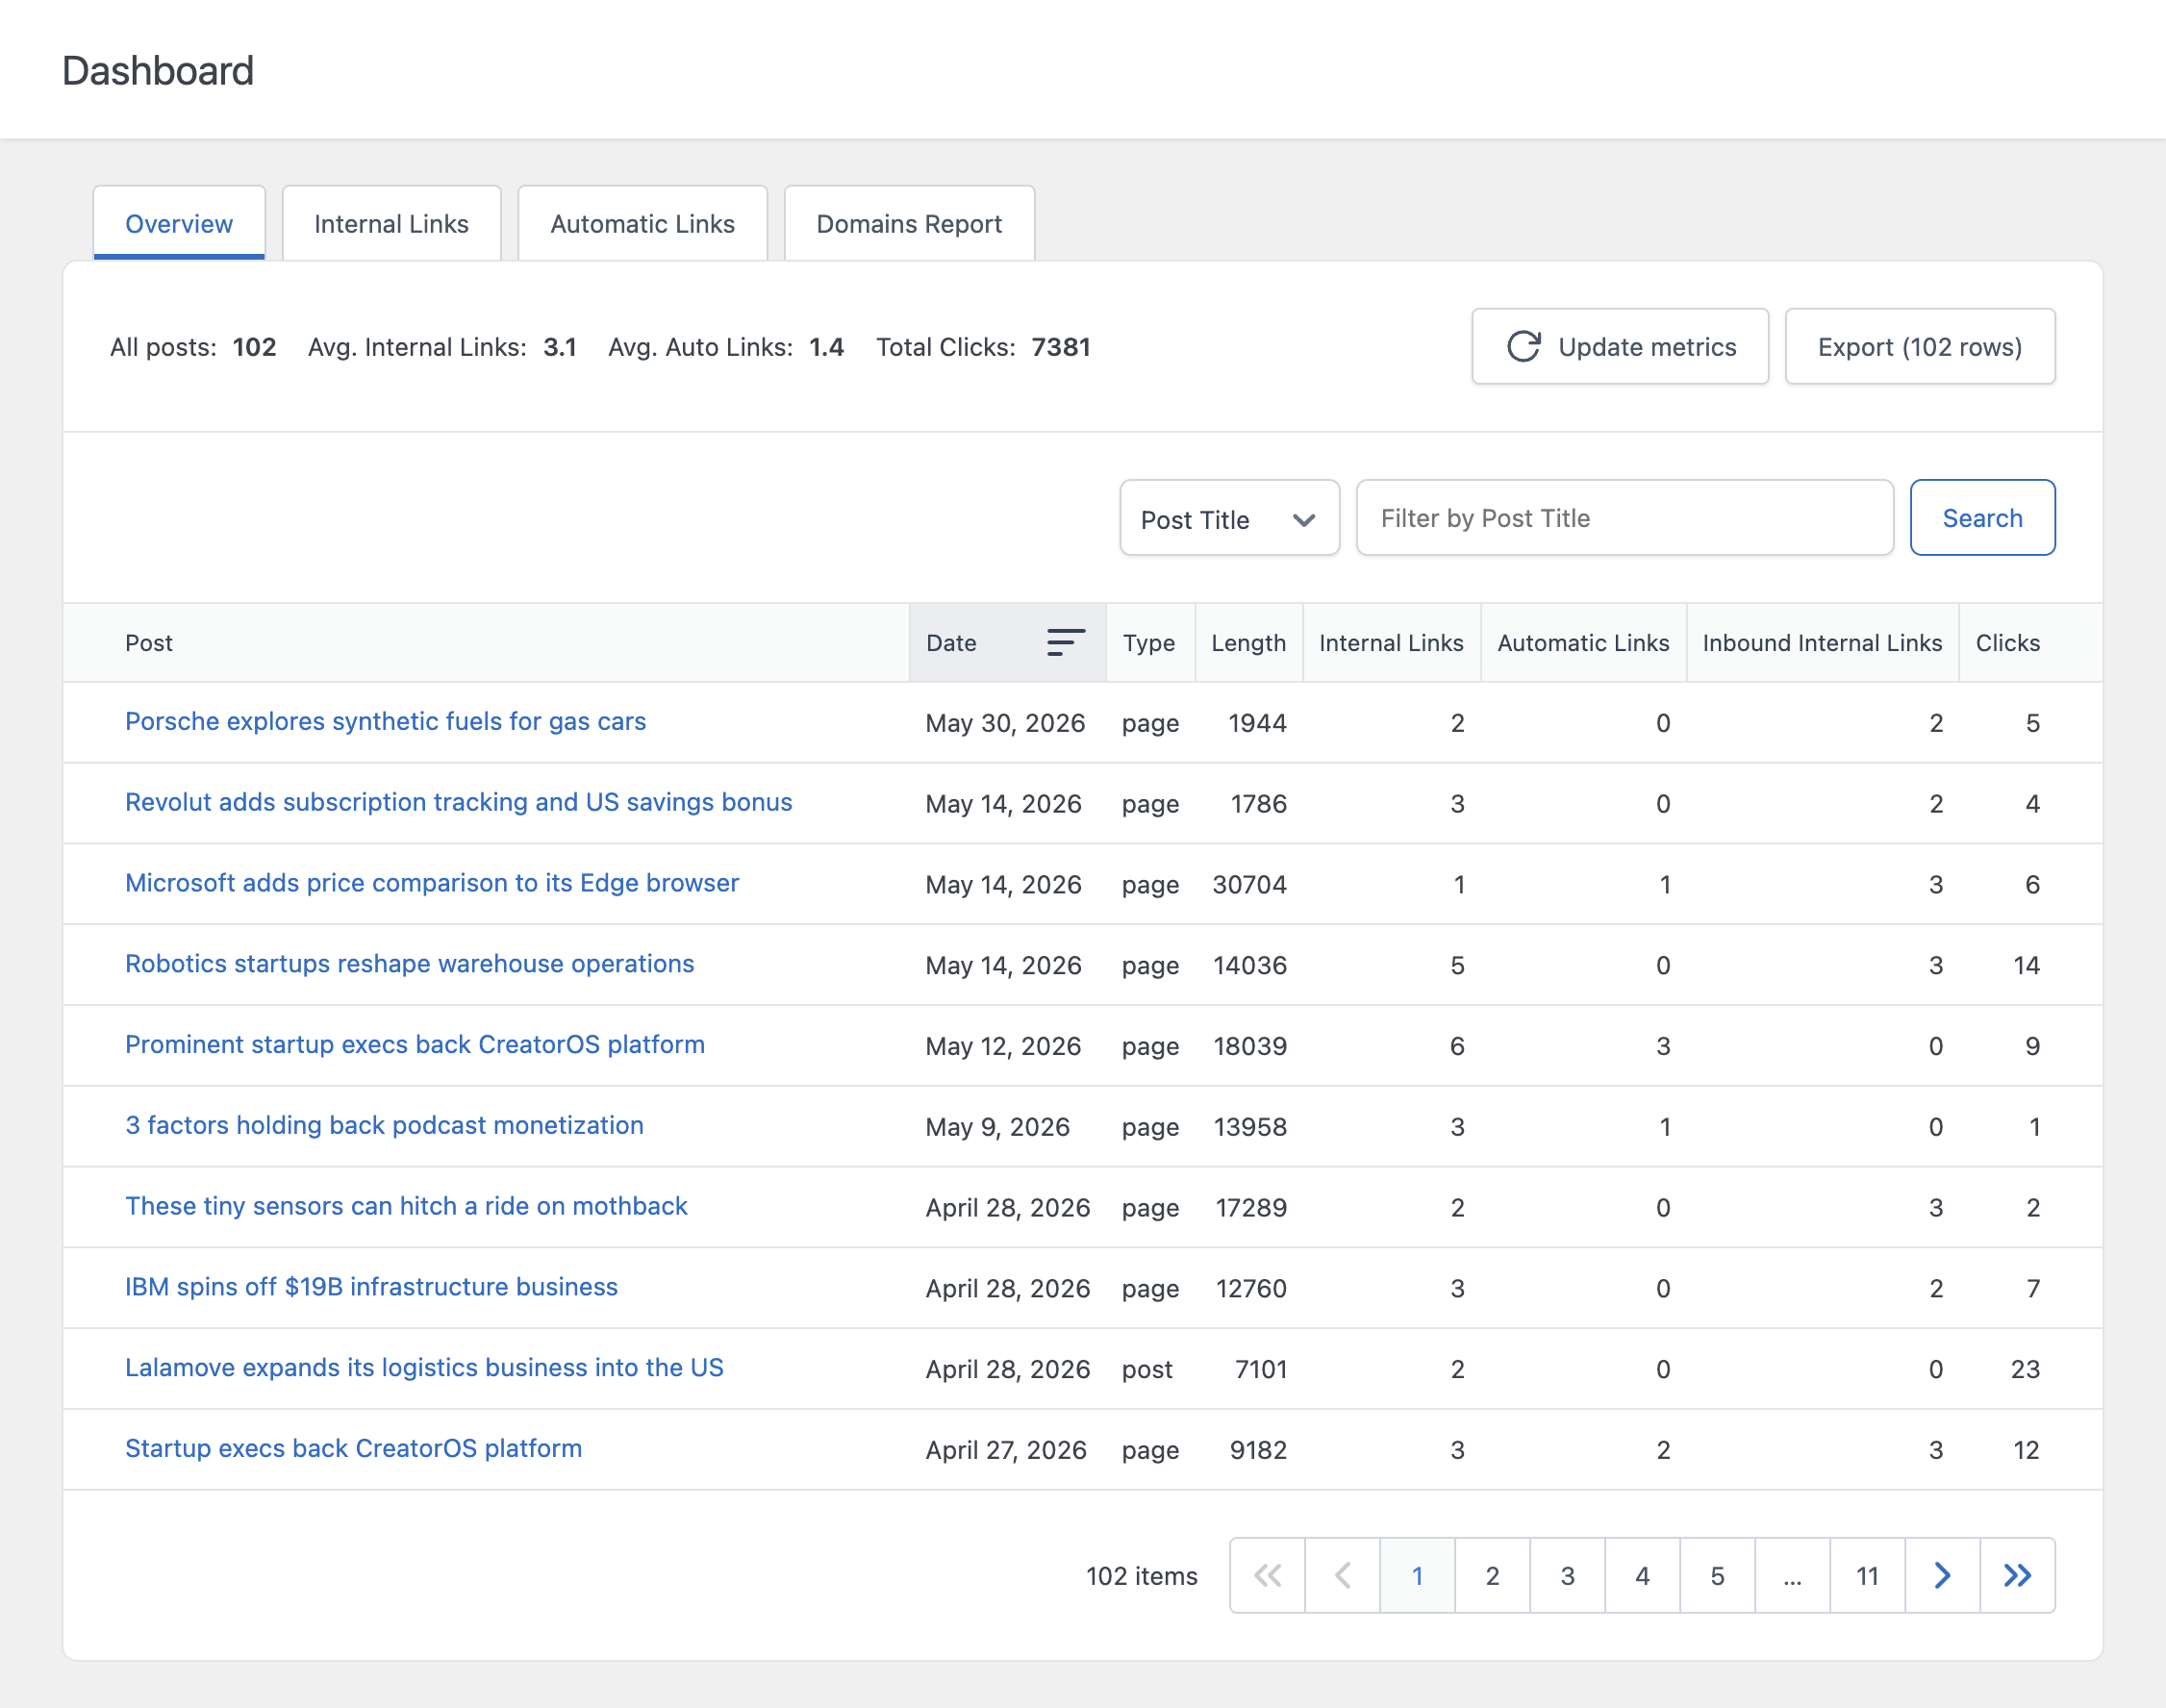
The Overview tab combines internal links, automatic links, and click data into a single table, giving you a high-level summary of your entire site.
At the top of the tab, the following summary statistics are displayed:
- All posts – The total number of posts analyzed in the report
- Avg. Internal Links – The average number of internal links per post
- Avg. Auto Links – The average number of automatic links per post
- Total Clicks – The total number of clicks registered on the links
The table below lists every analyzed post along with its content length, internal links, automatic links, inbound internal links, and click count.
The Total Clicks statistic and the click count are available in the Pro version, which includes click tracking.
Internal Links Tab
The Internal Links tab focuses specifically on manually placed and automatically generated internal links, and includes the optimization status for each post.
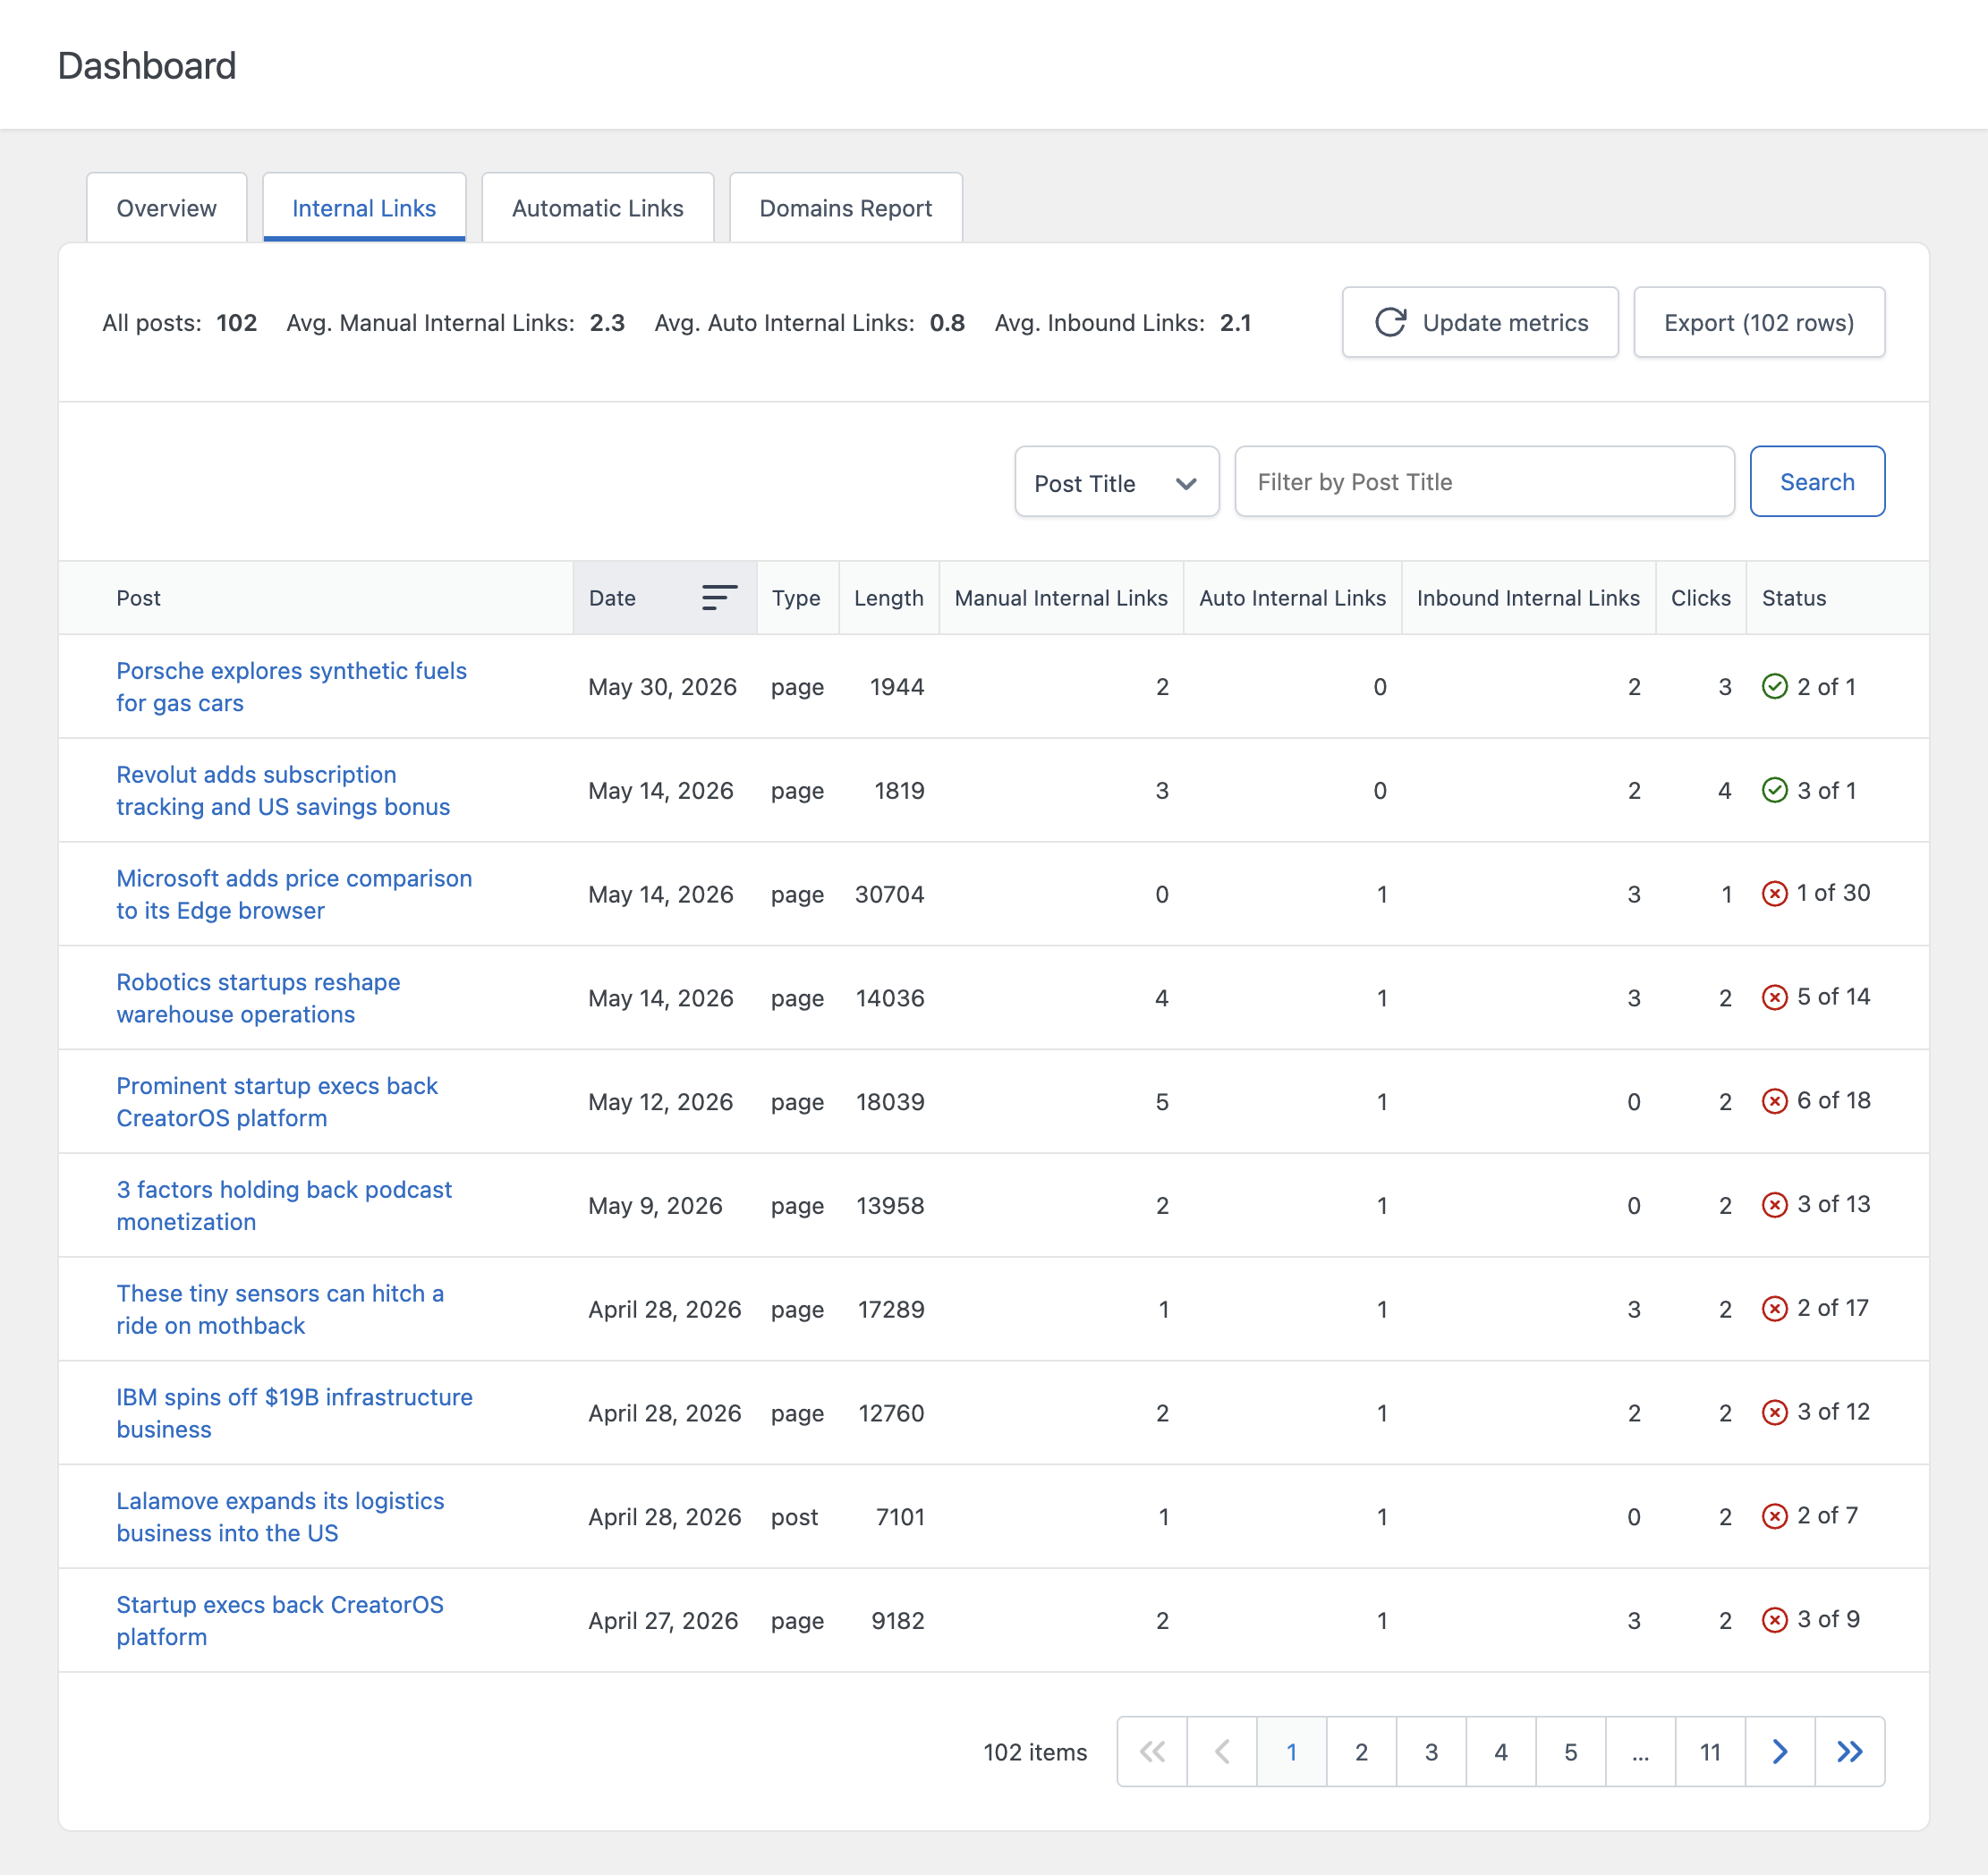
This tab includes a Status column, which indicates whether the number of internal links in a post is within the recommended range based on its content length. In the Pro version, the recommended number of links and the acceptable range are both configurable from the Settings menu.
Automatic Links Tab
The Automatic Links tab isolates the links generated specifically by your Auto Link Rules, separately from any manually placed internal links. This is useful when you want to evaluate the impact of your automatic linking rules without manually placed links affecting the numbers.
Domains Report Tab
The Domains Report tab shows every external domain referenced in your content, along with the number of posts that link to it and the total number of links pointing to it.
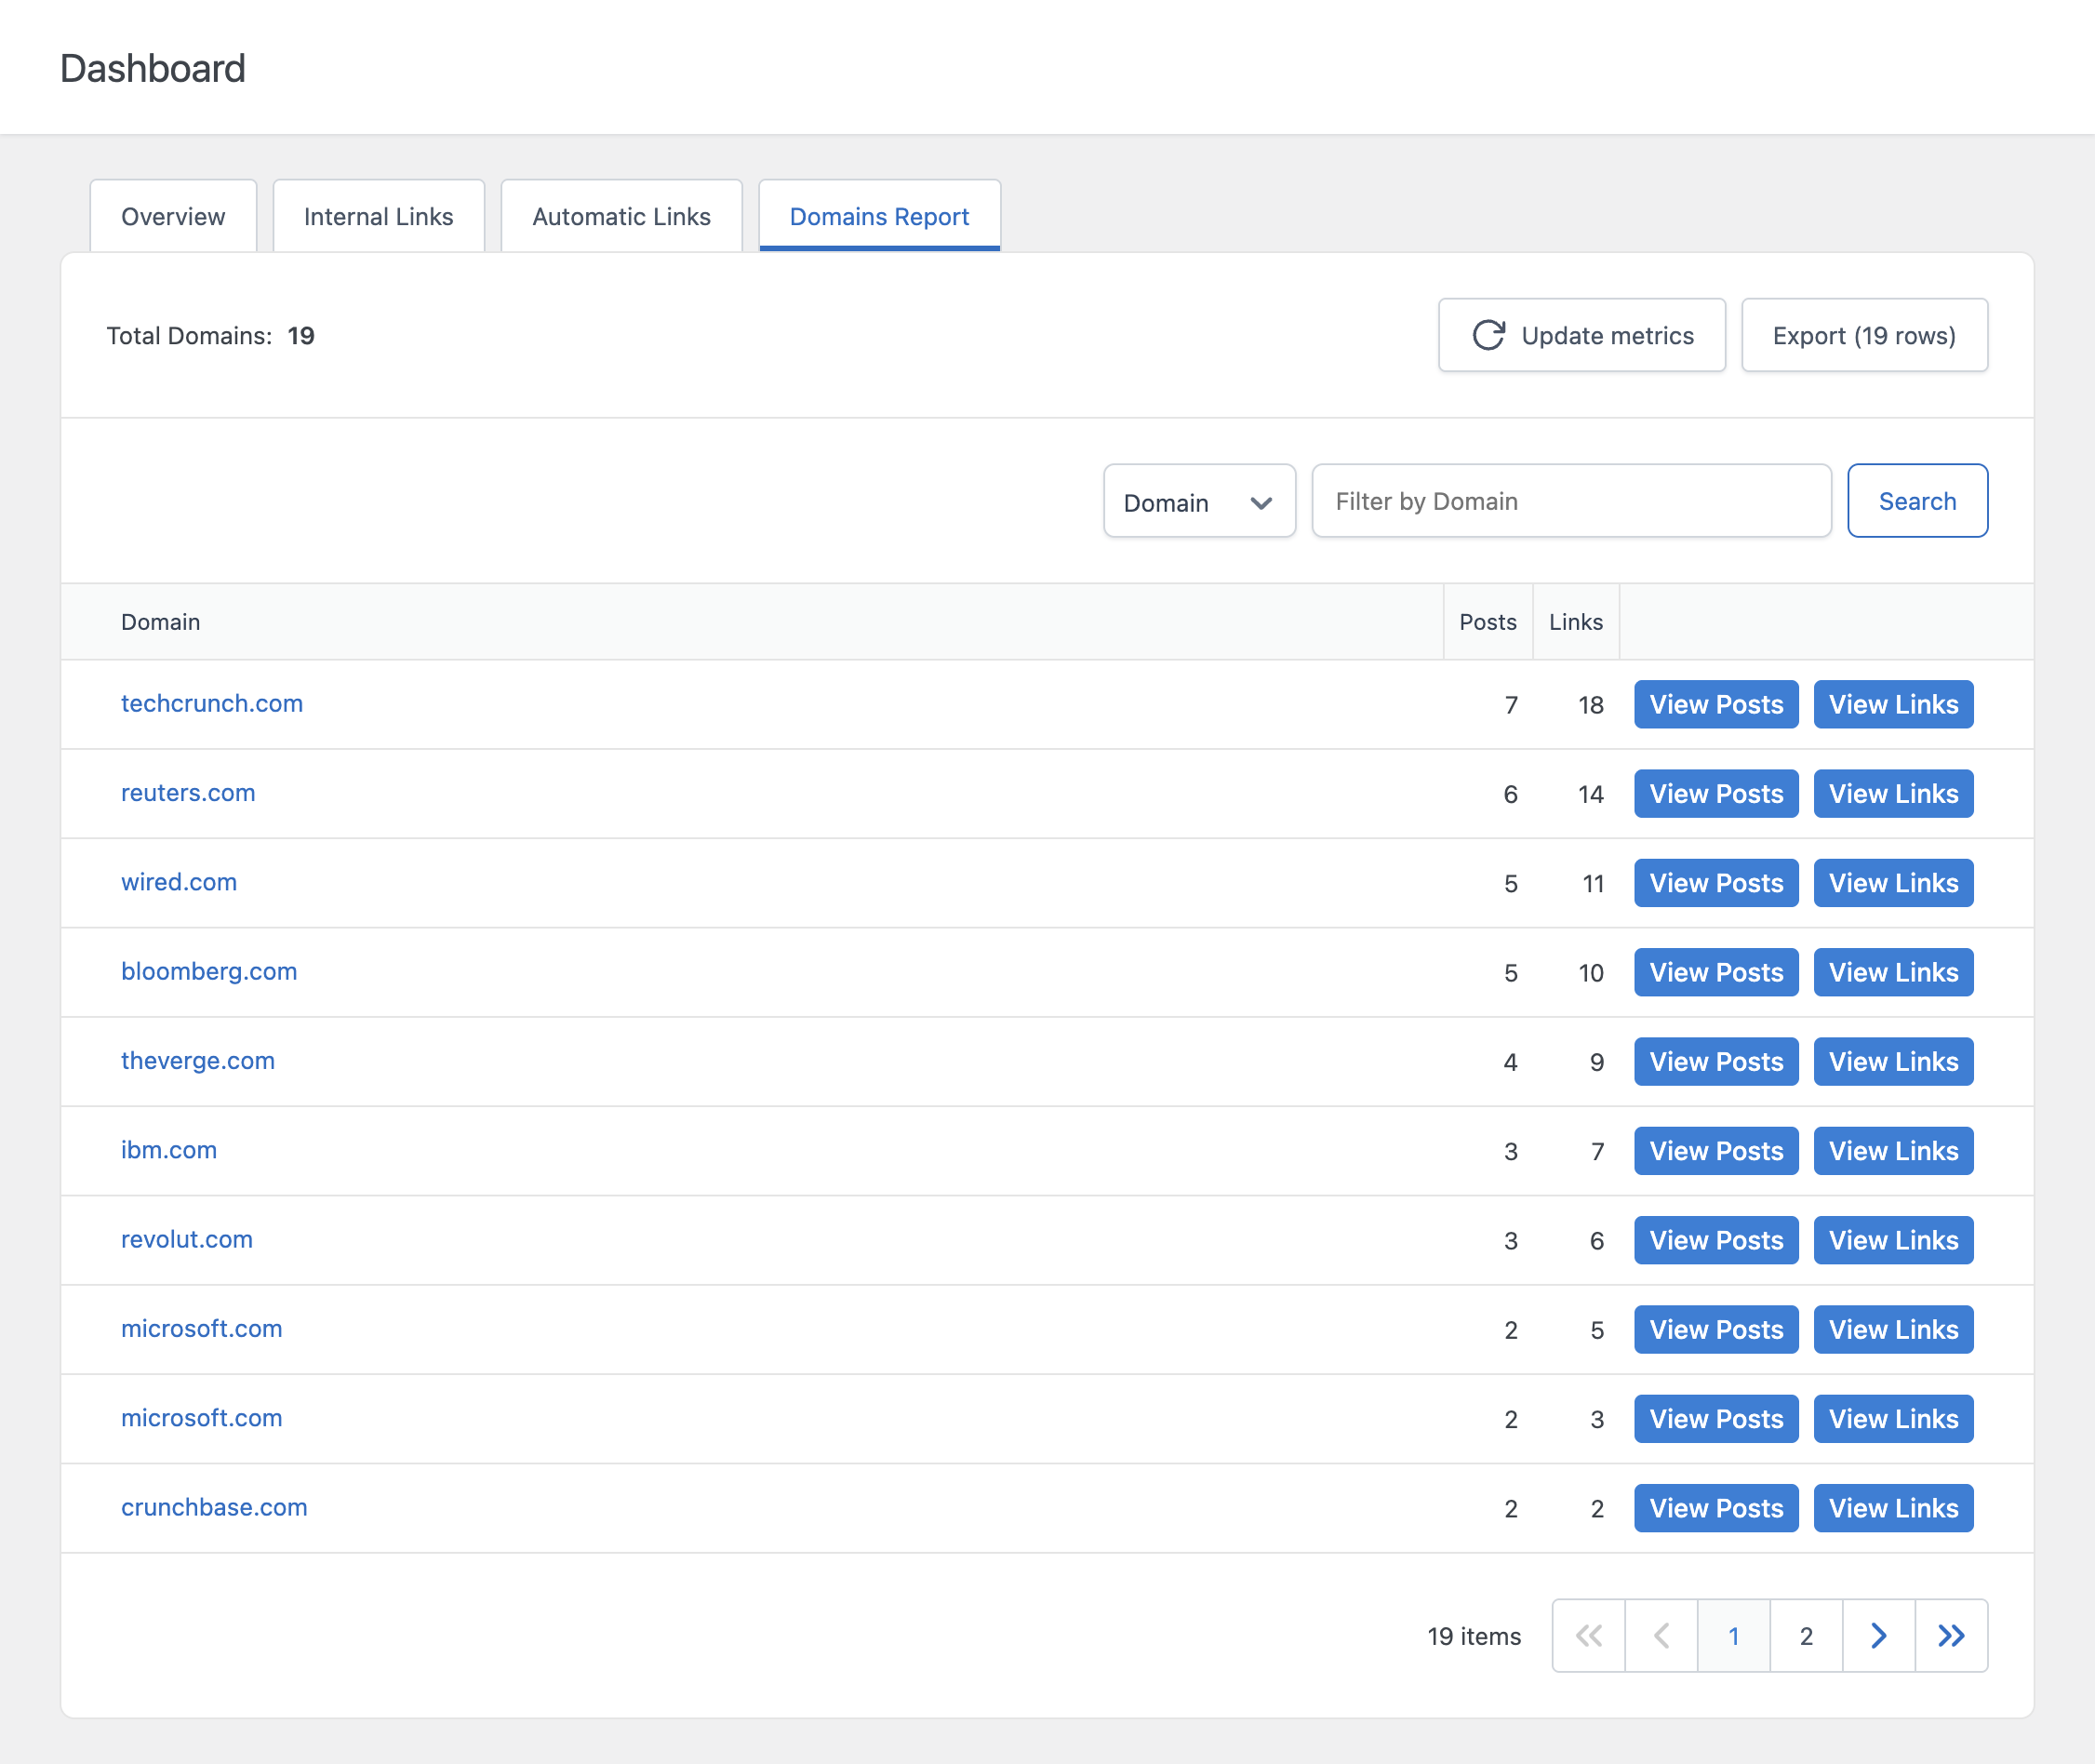
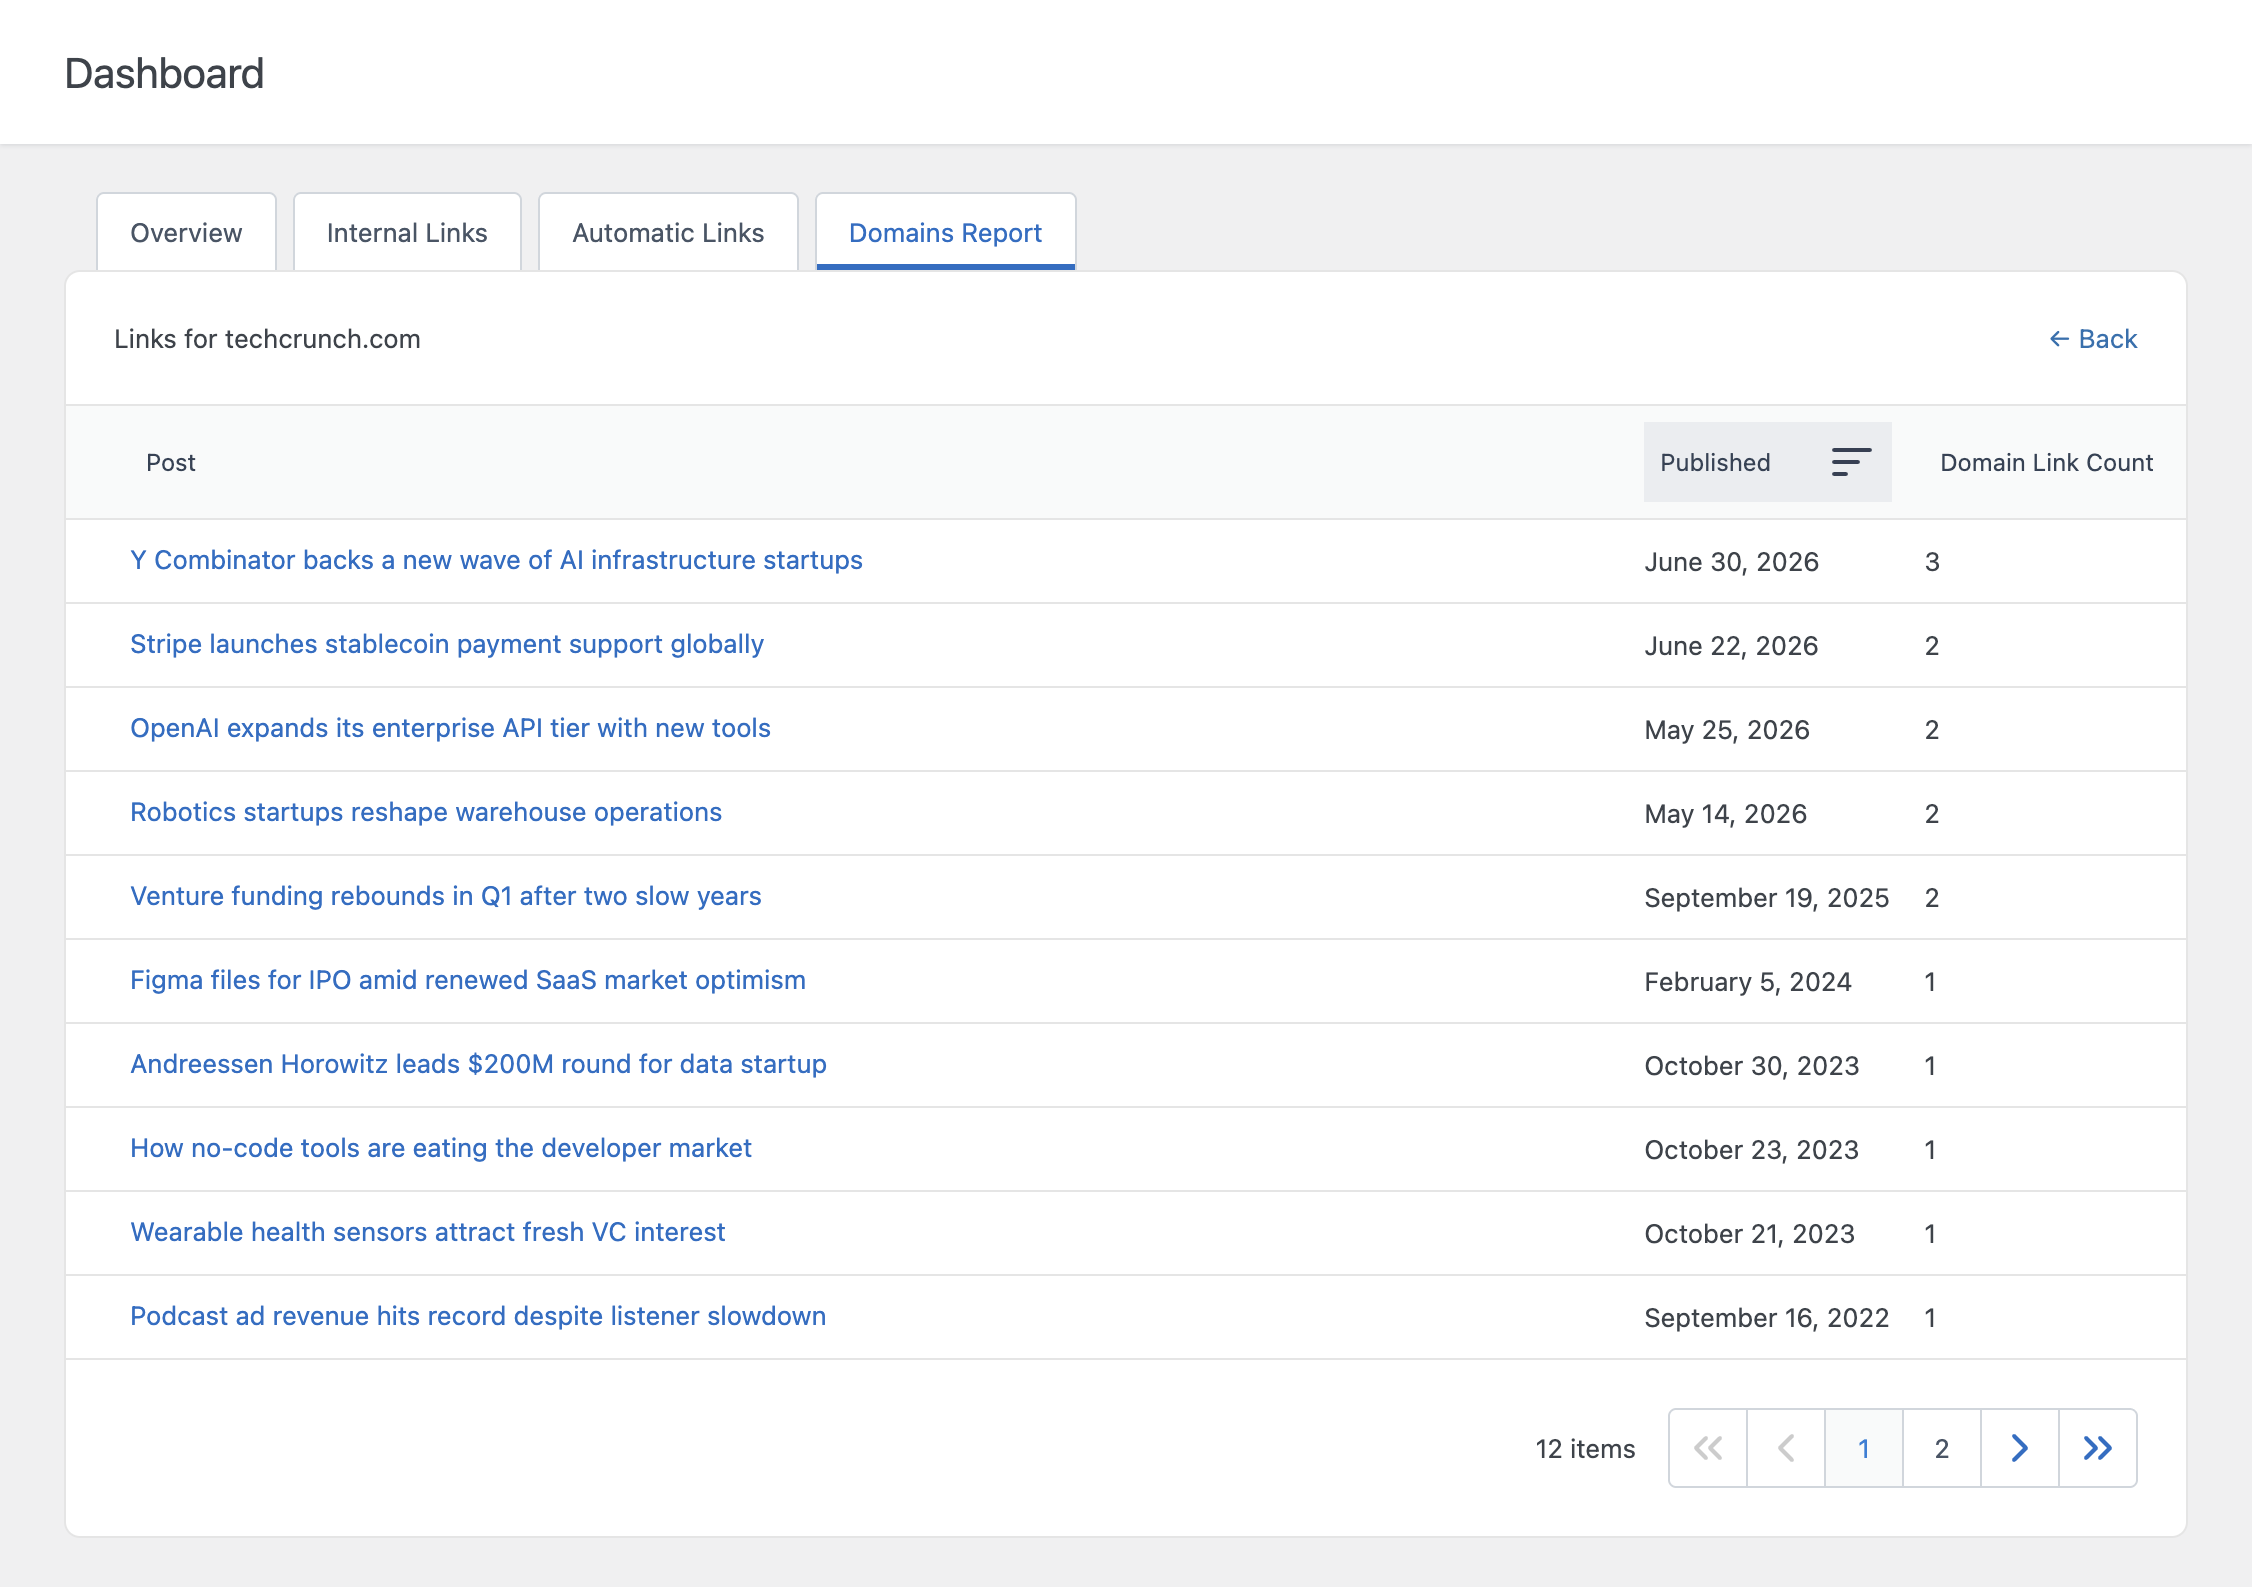
Each domain includes two buttons that open a drill-down view:
- View Posts – Lists every post that links to the selected domain, along with the publish date and how many times that domain is linked from each post
- View Links – Lists every individual link pointing to the selected domain, including the anchor text and the exact URL used
Clicking the domain name opens the external website in a new browser tab.
Link Graph Tab
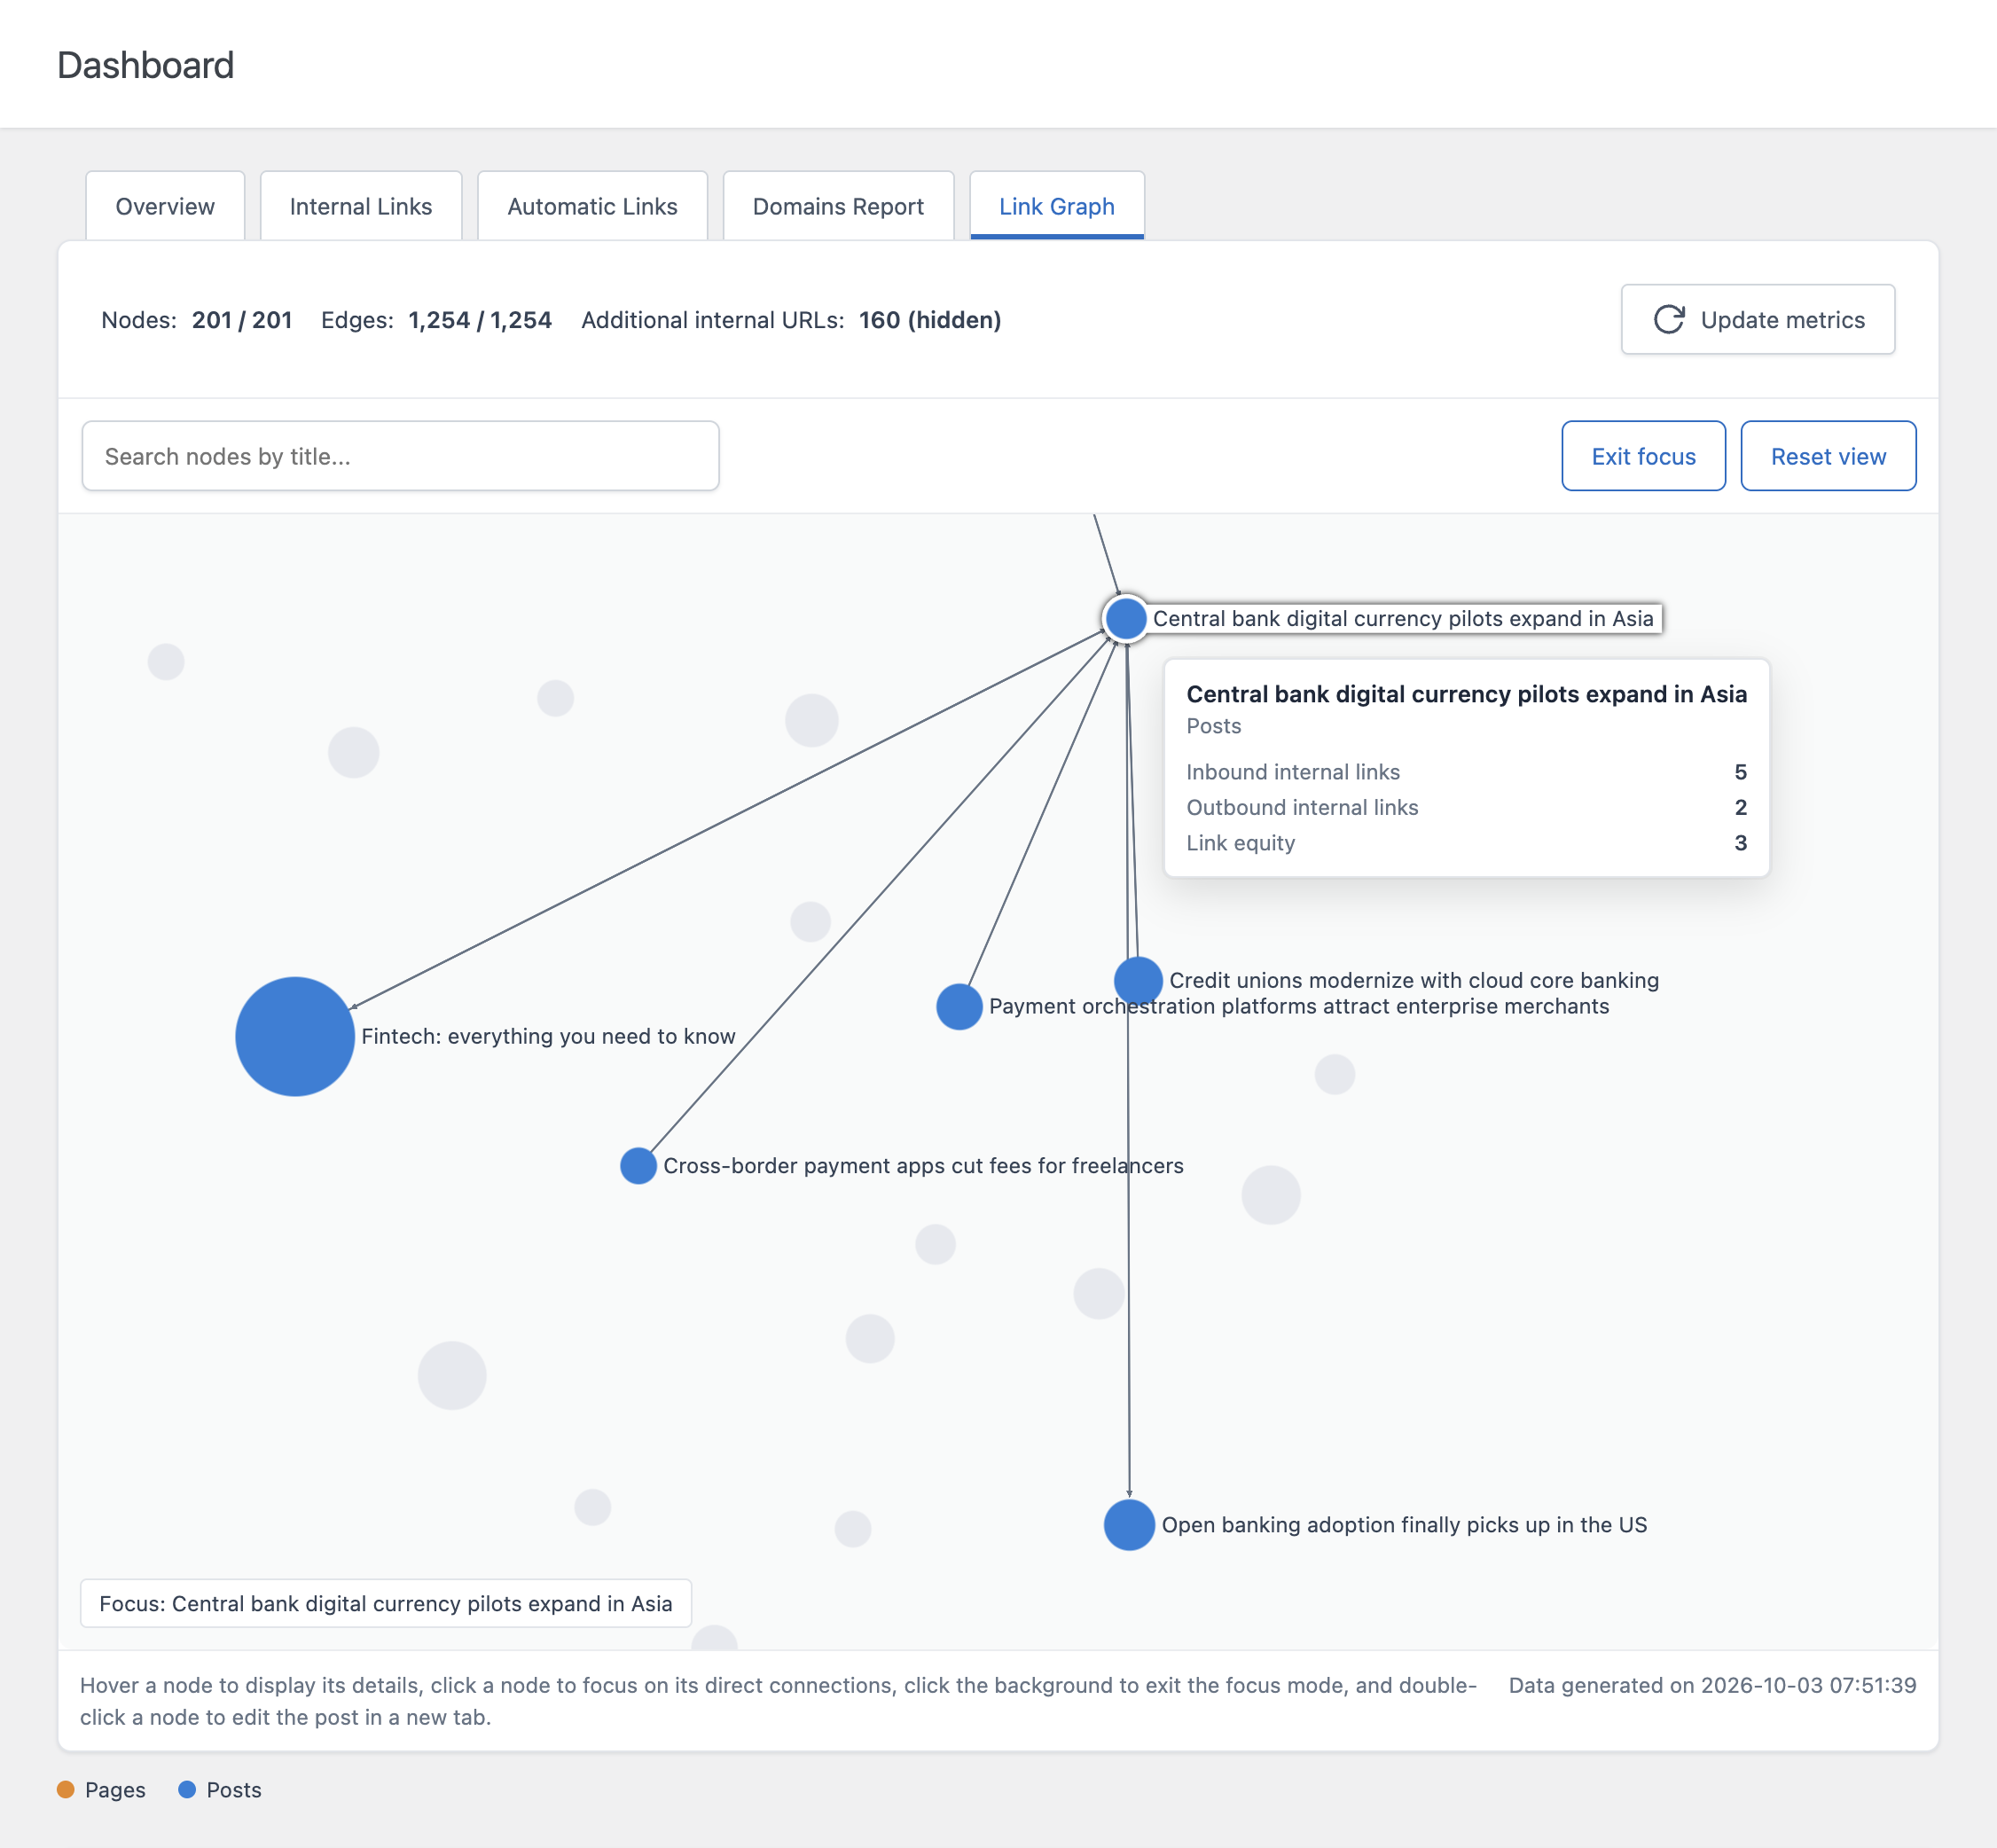
The Link Graph tab displays the link structure of your website as an interactive graph, with posts as nodes and internal links as connections. It helps you spot orphan posts, heavily linked pages, and isolated groups of content at a glance.
Refreshing the Data
The data displayed in each tab is not calculated in real time. It is generated periodically and cached for performance reasons. Each tab includes an Update metrics button that lets you manually trigger a recalculation at any time.
The Overview, Internal Links, and Domains Report tabs also update their data automatically when you open them, if the existing data is more than one hour old. For the Automatic Links tab, you can configure how often the data refreshes automatically from the Dashboard Data Update Frequency option in the Settings menu, with choices ranging from Never to Monthly.
Filtering and Sorting
Every table tab supports filtering by column. Use the filter dropdown above the table to narrow results by post title, date, post type, content length, or any of the numeric metrics relevant to that tab. Click any column header to sort the table by that column.
Exporting Data
In the Pro version, each table tab includes an Export button that downloads the data currently displayed in the table as a file. The button label shows the number of rows that will be included in the export, and is disabled when the table has no data to export.