Link Graph: Visualizing Your Link Structure
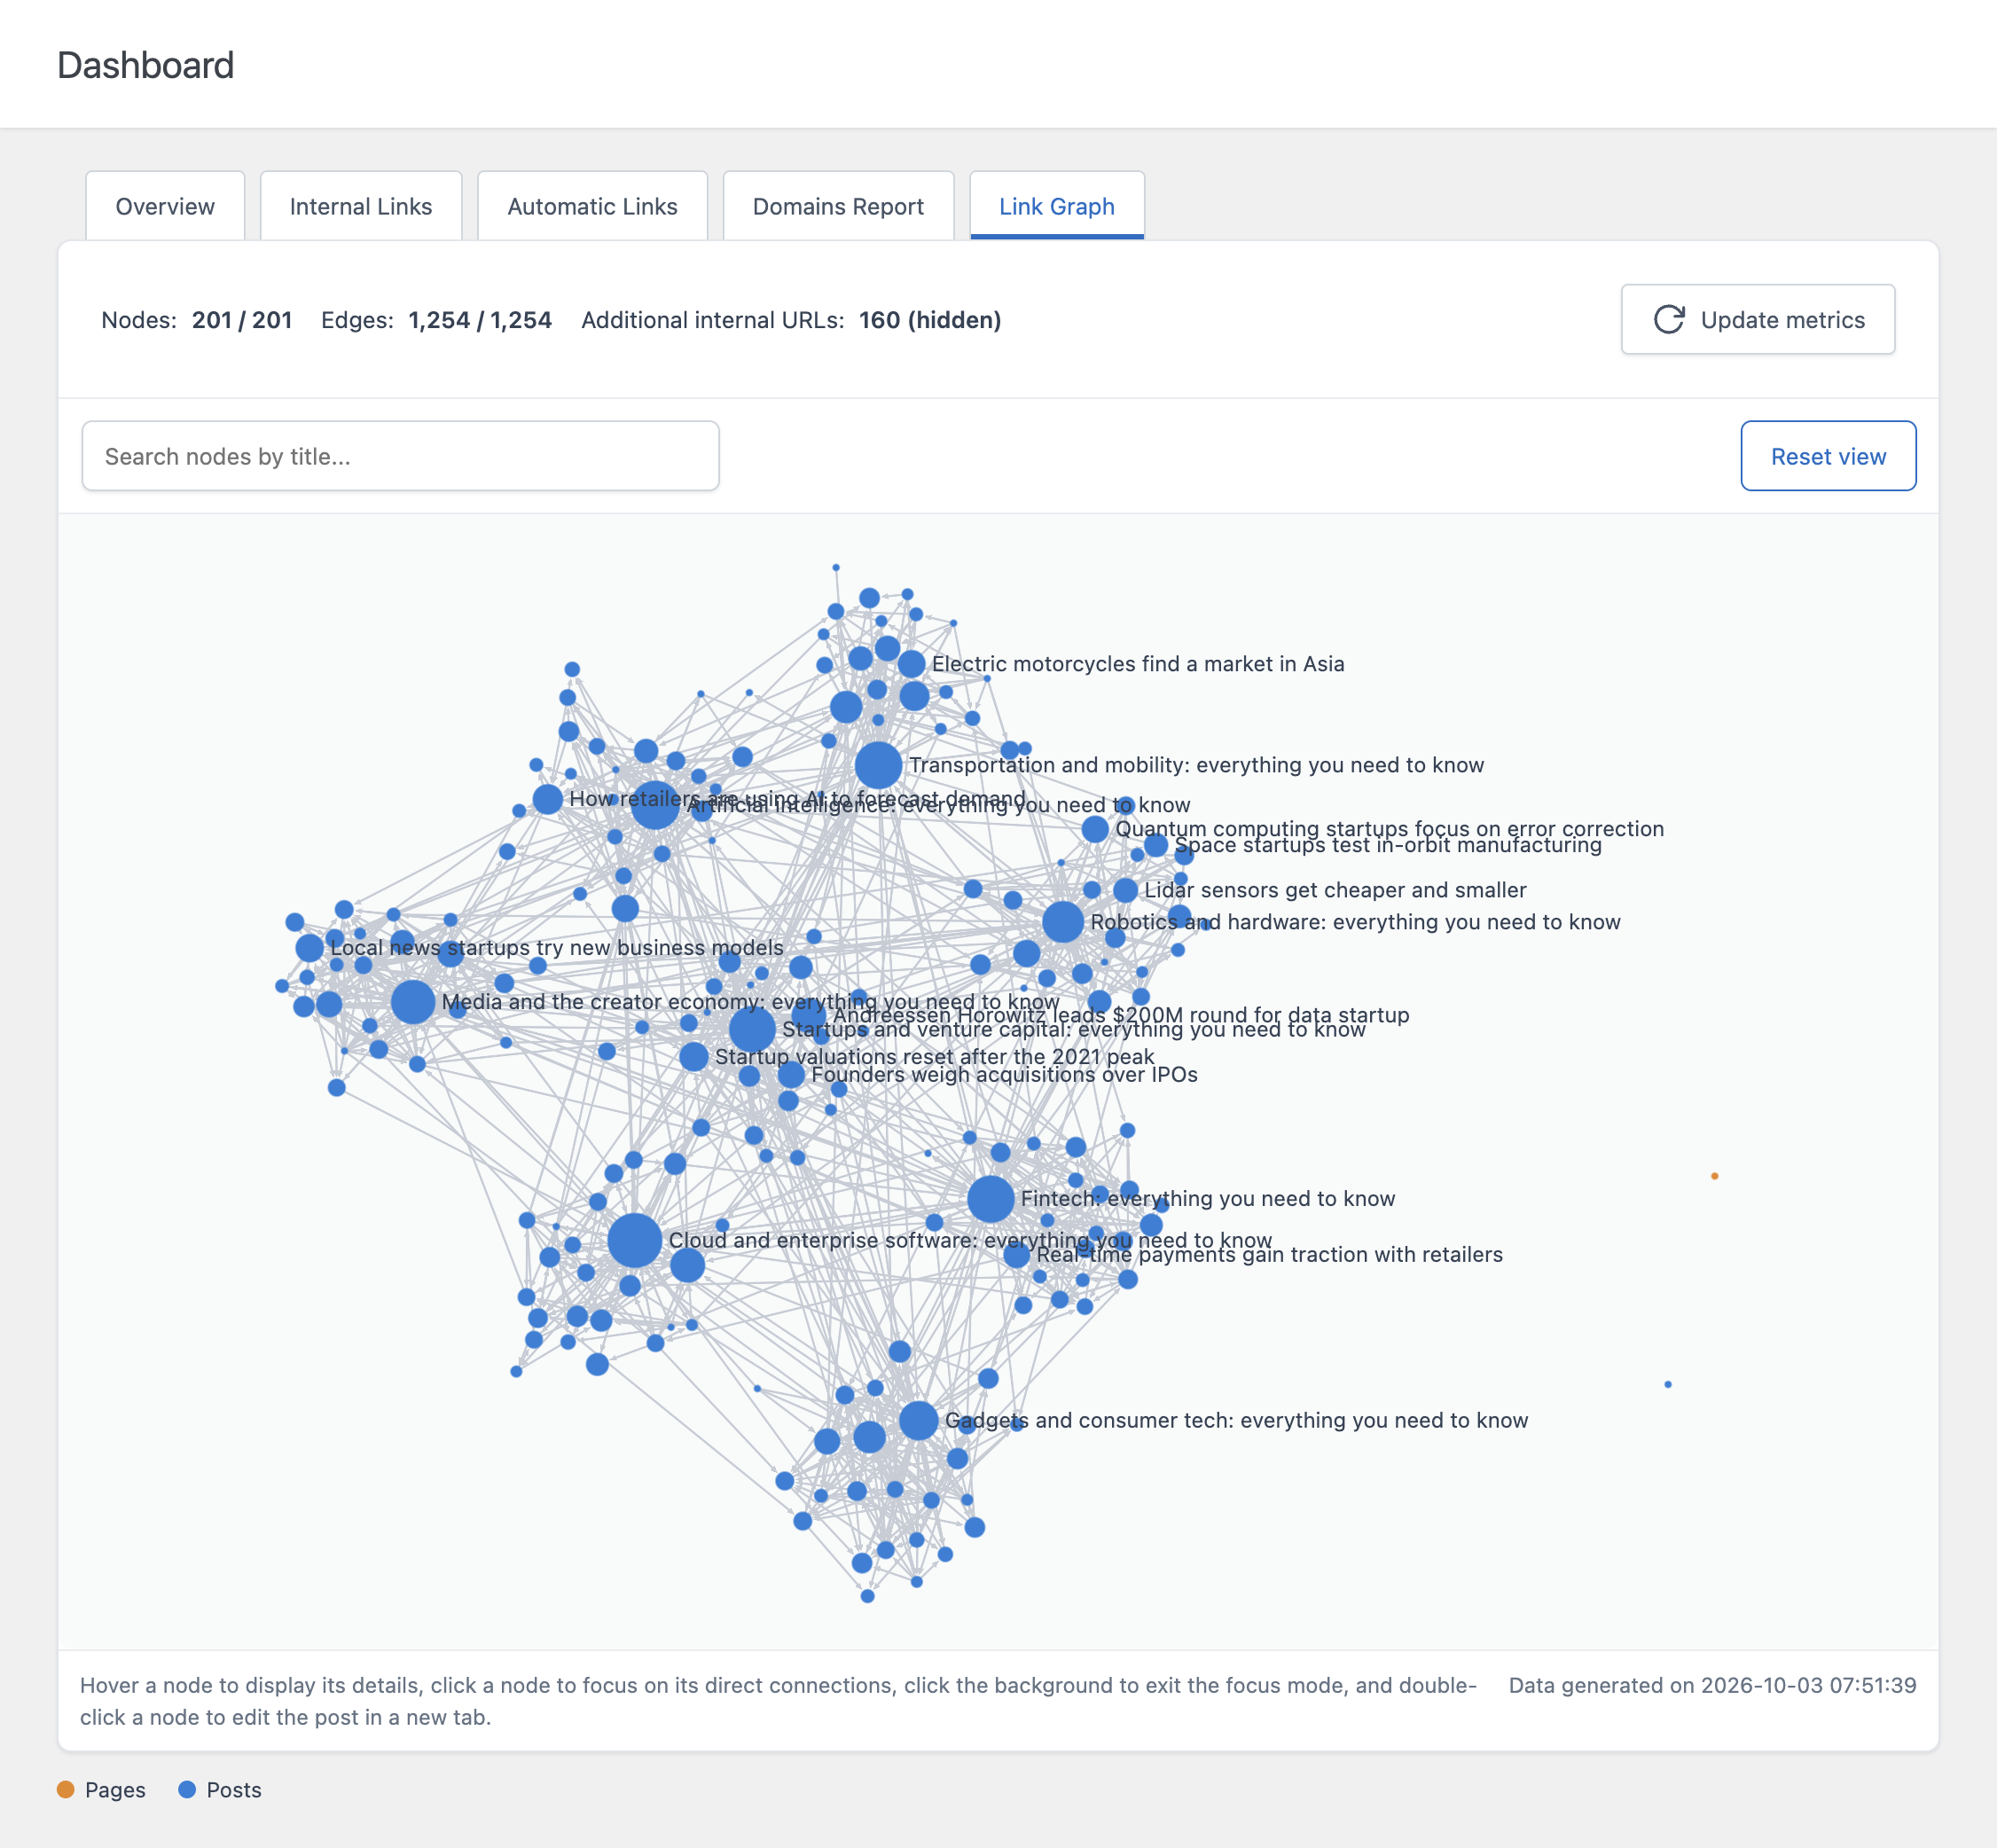
The Link Graph tab of the Dashboard displays the link structure of your website as an interactive graph. Each post is a node, and each internal link is a connection between two nodes. It turns the numbers of the other Dashboard tabs into a picture, so you can spot orphan posts, heavily linked hubs, and isolated groups of content at a glance.
Opening the Link Graph
Open the Dashboard menu of Link Manager and select the Link Graph tab.
The graph is built from the data of the Internal Links tab. If that data has never been generated on your site, the tab displays a message instead of the graph. Use the Go to Internal Links button, let the tab generate the data, then return to the Link Graph.
Reading the Graph
Nodes
The graph can contain three kinds of nodes:
- Posts – The posts included in the analysis. Their color depends on the post type, and the legend below the graph lists the colors
- External domains – The external websites your posts link to. Displayed only when the link type includes external links
- Additional internal URLs – Internal URLs that are not included in the analysis, like archives, the home page, posts of excluded post types, or deleted posts. Hidden by default
By default, the size of a post node is proportional to its link equity, so the most important pages of your site stand out immediately.
Connections
Each connection is drawn as an arrow from the post that contains the link to the page it points to. When a post links to the same page more than once, the links are combined into a single connection.
The Layout
When the graph loads, the nodes arrange themselves automatically for a few seconds. Posts that link to each other move closer together, and unrelated posts drift apart. The movement stops by itself once the positions settle.
The result is a map of your content: groups of nodes close to each other are topics that are well linked together, and nodes at the edges are posts with few connections.
The Header
The header above the graph summarizes what is displayed:
- Nodes – The number of visible nodes, followed by the total number of nodes loaded
- Edges – The number of visible connections, followed by the total
- Additional internal URLs – The number of internal URLs not included in the analysis. Hover over the value to see how many links point to them. The value is marked as hidden when these nodes are not displayed
- External domains – The number of external domains. Displayed only when the link type includes external links
Where the Data Comes From
The Link Graph does not scan your content on its own. It displays data that the plugin has already generated:
- Posts and internal links come from the data of the Internal Links tab of the Dashboard
- External domains come from the data of the Domains Report tab
The date of the data is displayed at the bottom right of the graph. When external links are displayed, two dates are shown, one for each source, because the two datasets are generated separately.
To regenerate the data without leaving the tab, use the Update metrics button in the header. It regenerates the internal links data, and also the Domains Report data when external links are displayed, then rebuilds the graph. On large sites this can take some time.
If you select external links and the Domains Report has never been generated, the graph displays the internal links only, with a notice and a Go to Domains Report button.
For details on the two tabs, refer to the dedicated documentation on internal links statistics and the dedicated documentation on the Domains Report.
Exploring the Graph
- Zoom and pan – Use the mouse wheel or the trackpad to zoom, and drag the background to move around
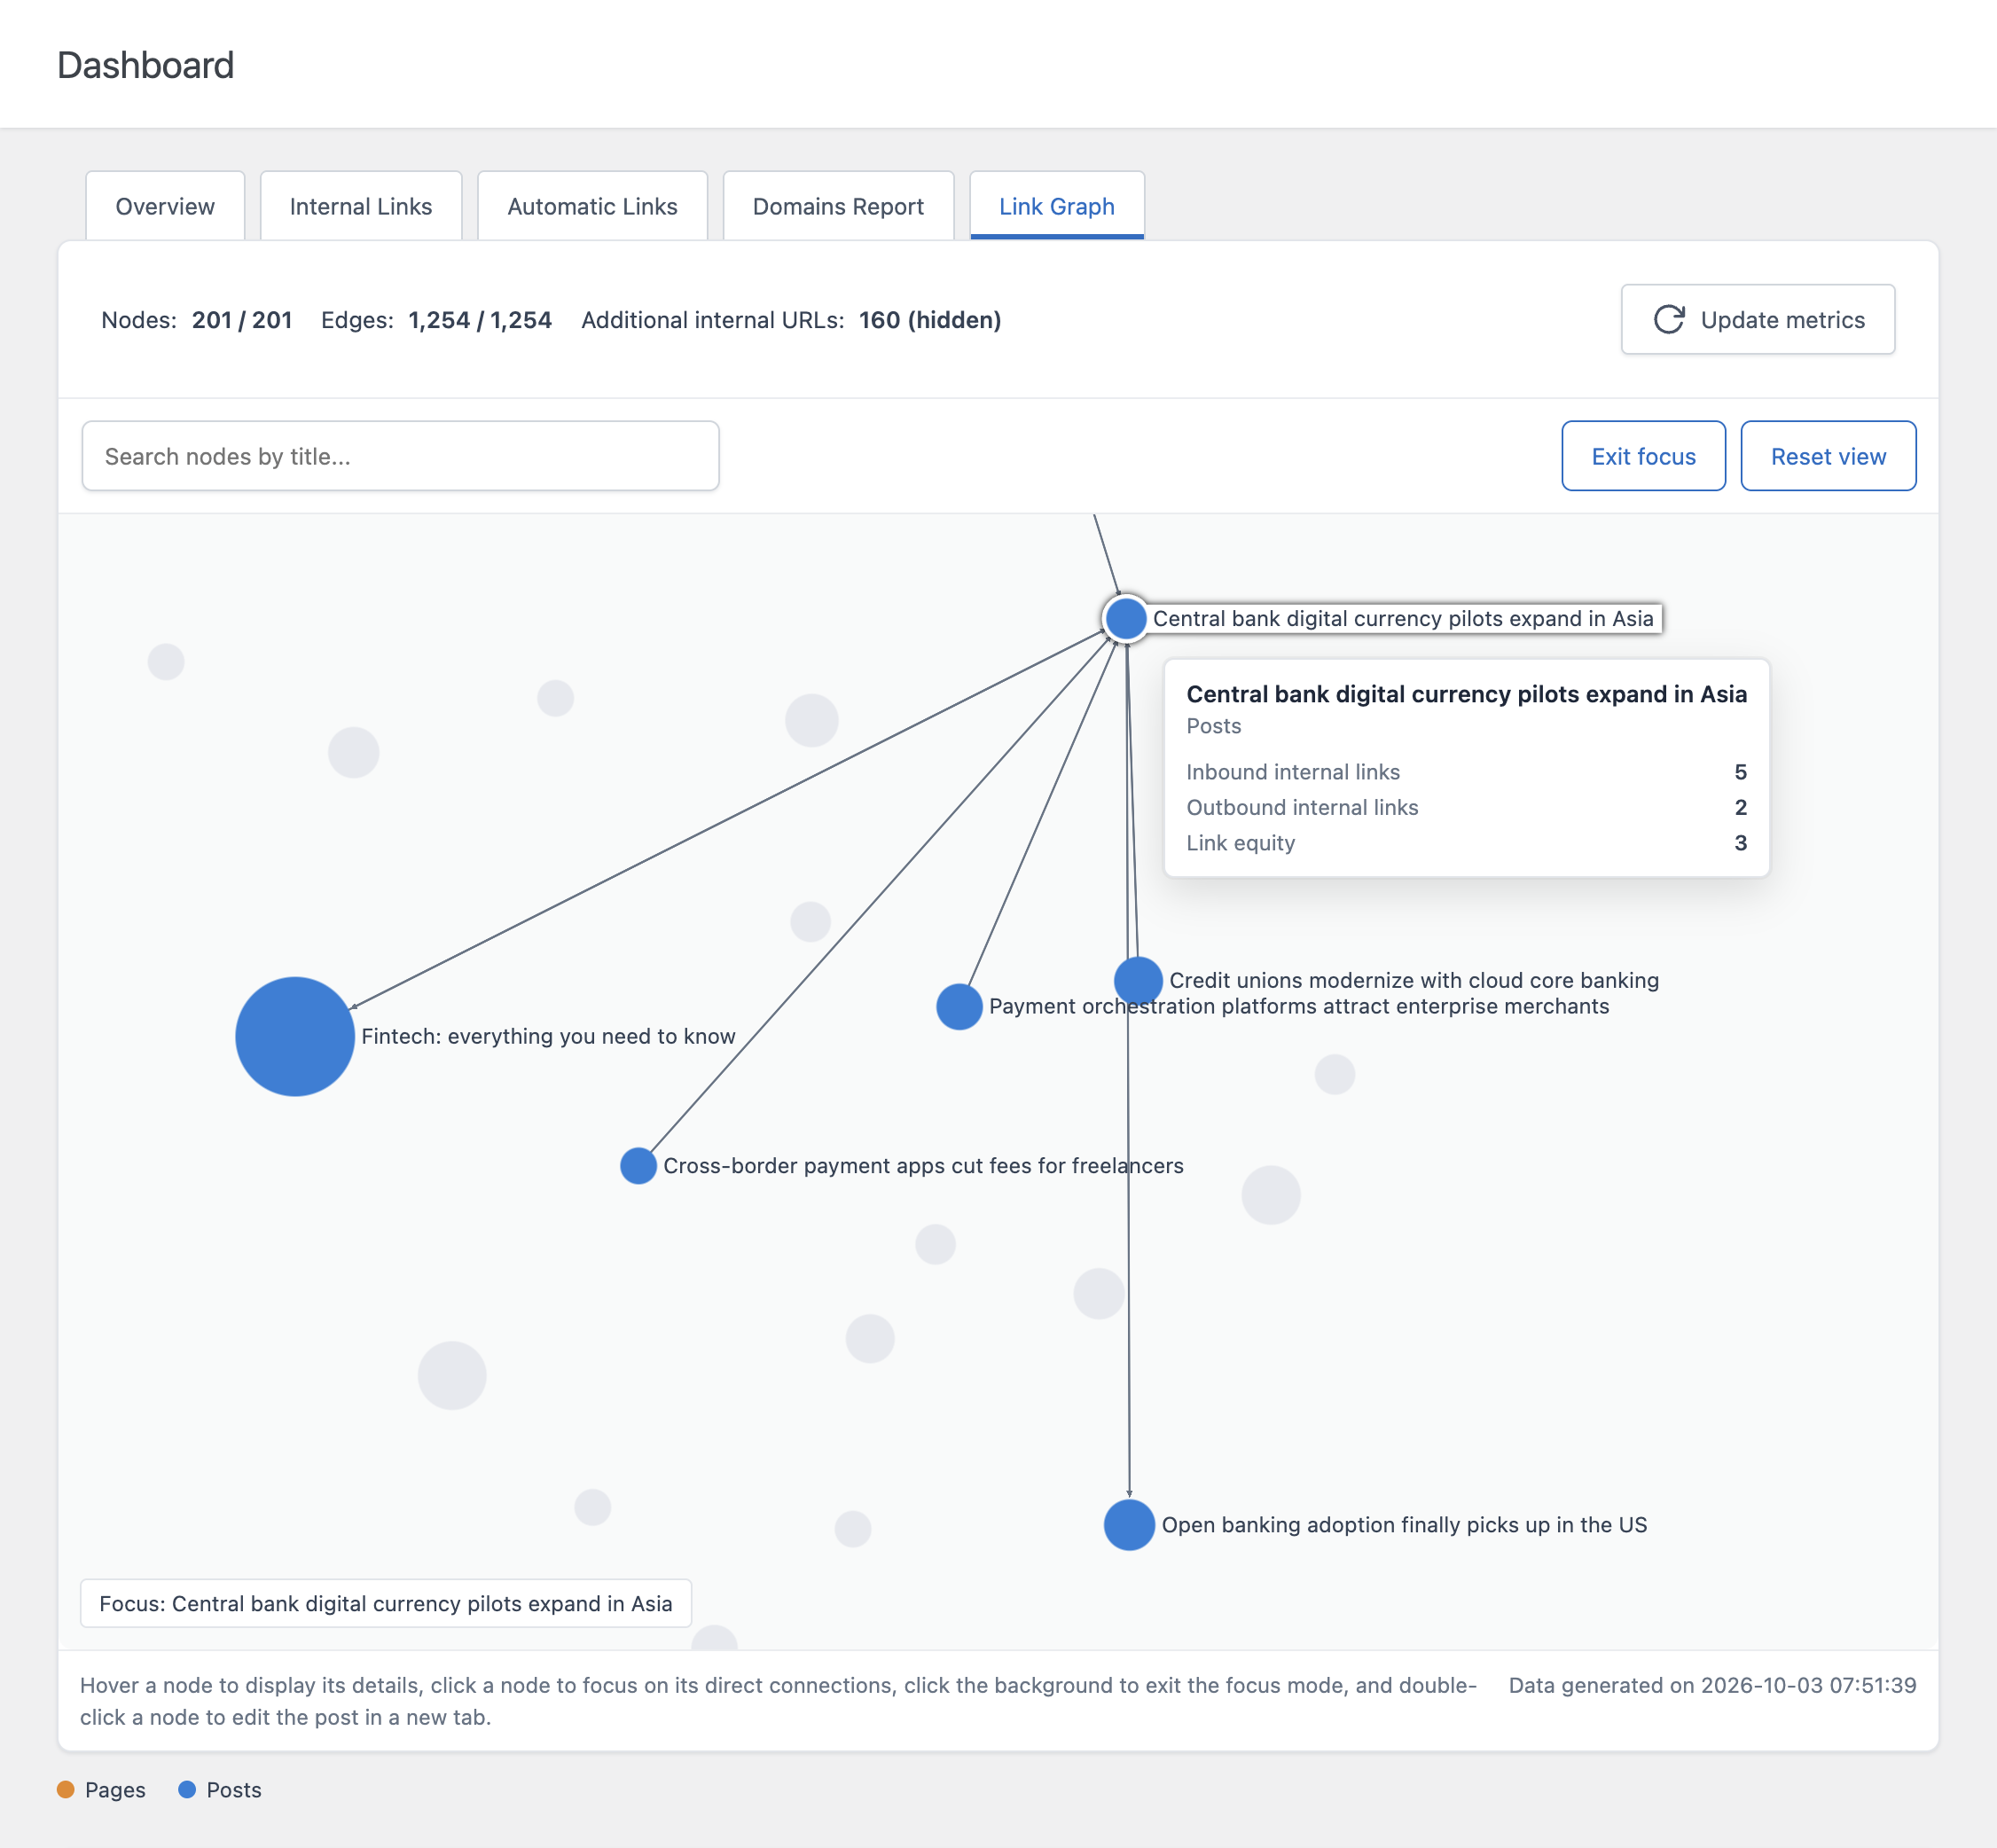
- Hover a node – Displays a tooltip with the details of the node. For posts: the post type, the inbound internal links, the outbound internal links, and the link equity. For additional internal URLs: the number of internal links pointing to the URL and its link equity. For external domains: the number of external links pointing to the domain
- Click a node – Enters the focus mode: the node and its direct connections stay highlighted, while the rest of the graph is dimmed. The name of the focused node appears in the bottom left corner
- Click the background – Exits the focus mode. You can also use the Exit focus button
- Double-click a node – Opens the edit screen of the post in a new tab. For an additional internal URL, it opens the URL itself
- Search – Type part of a title in the search field and select a result. The graph zooms on the node and enters the focus mode. Press Enter to select the first result. Only the visible nodes are searched
- Reset view – Restores the initial zoom and position, and exits the focus mode
The Settings Panel
The settings panel on the right controls what the graph displays. It’s organized in four sections. Appearance, Filters, and Advanced are collapsed by default. When a collapsed section contains a setting that differs from its default, its title displays the number of active settings, so a filter is never active without you noticing.
The settings apply to the current view and are reset when the page is reloaded.
Data
- Link type – Displays Internal links, External links, or Internal and external links. The default value is set with the Link Graph Default Link Type option
- Post types – Limits the graph to one or more post types. Leave it empty to display all the analyzed post types
Appearance
- Node size by – Sizes the post nodes by Link equity, Inbound links, or Outbound links
- Node color by – Colors the post nodes by Post type, or by Optimization status. With the optimization status, the legend shows which posts are Optimized and which are Not optimized, based on the recommended number of internal links. Refer to the dedicated documentation on internal links statistics for details on how the optimization is calculated
- Show labels – Displays the titles next to the nodes. Labels of smaller nodes appear as you zoom in
Filters
- Show orphans only – Displays only the posts without inbound internal links
- More outbound than inbound – Displays only the posts with more outbound internal links than inbound internal links
- Only show main cluster – Displays only the largest group of connected nodes
- Hide unconnected nodes – Hides the nodes that have no visible connections
- Minimum inbound links – Displays only the posts with at least the selected number of inbound internal links. The maximum value of the slider is the highest number of inbound links in the current graph
The filters apply to the posts. External domains and additional internal URLs remain visible only when a visible post links to them.
Advanced
- Additional internal URLs – Includes the internal URLs that are not included in the analysis, like archives, the home page, posts of excluded post types, or deleted posts. They are displayed as gray nodes. Disabled by default
Common Uses
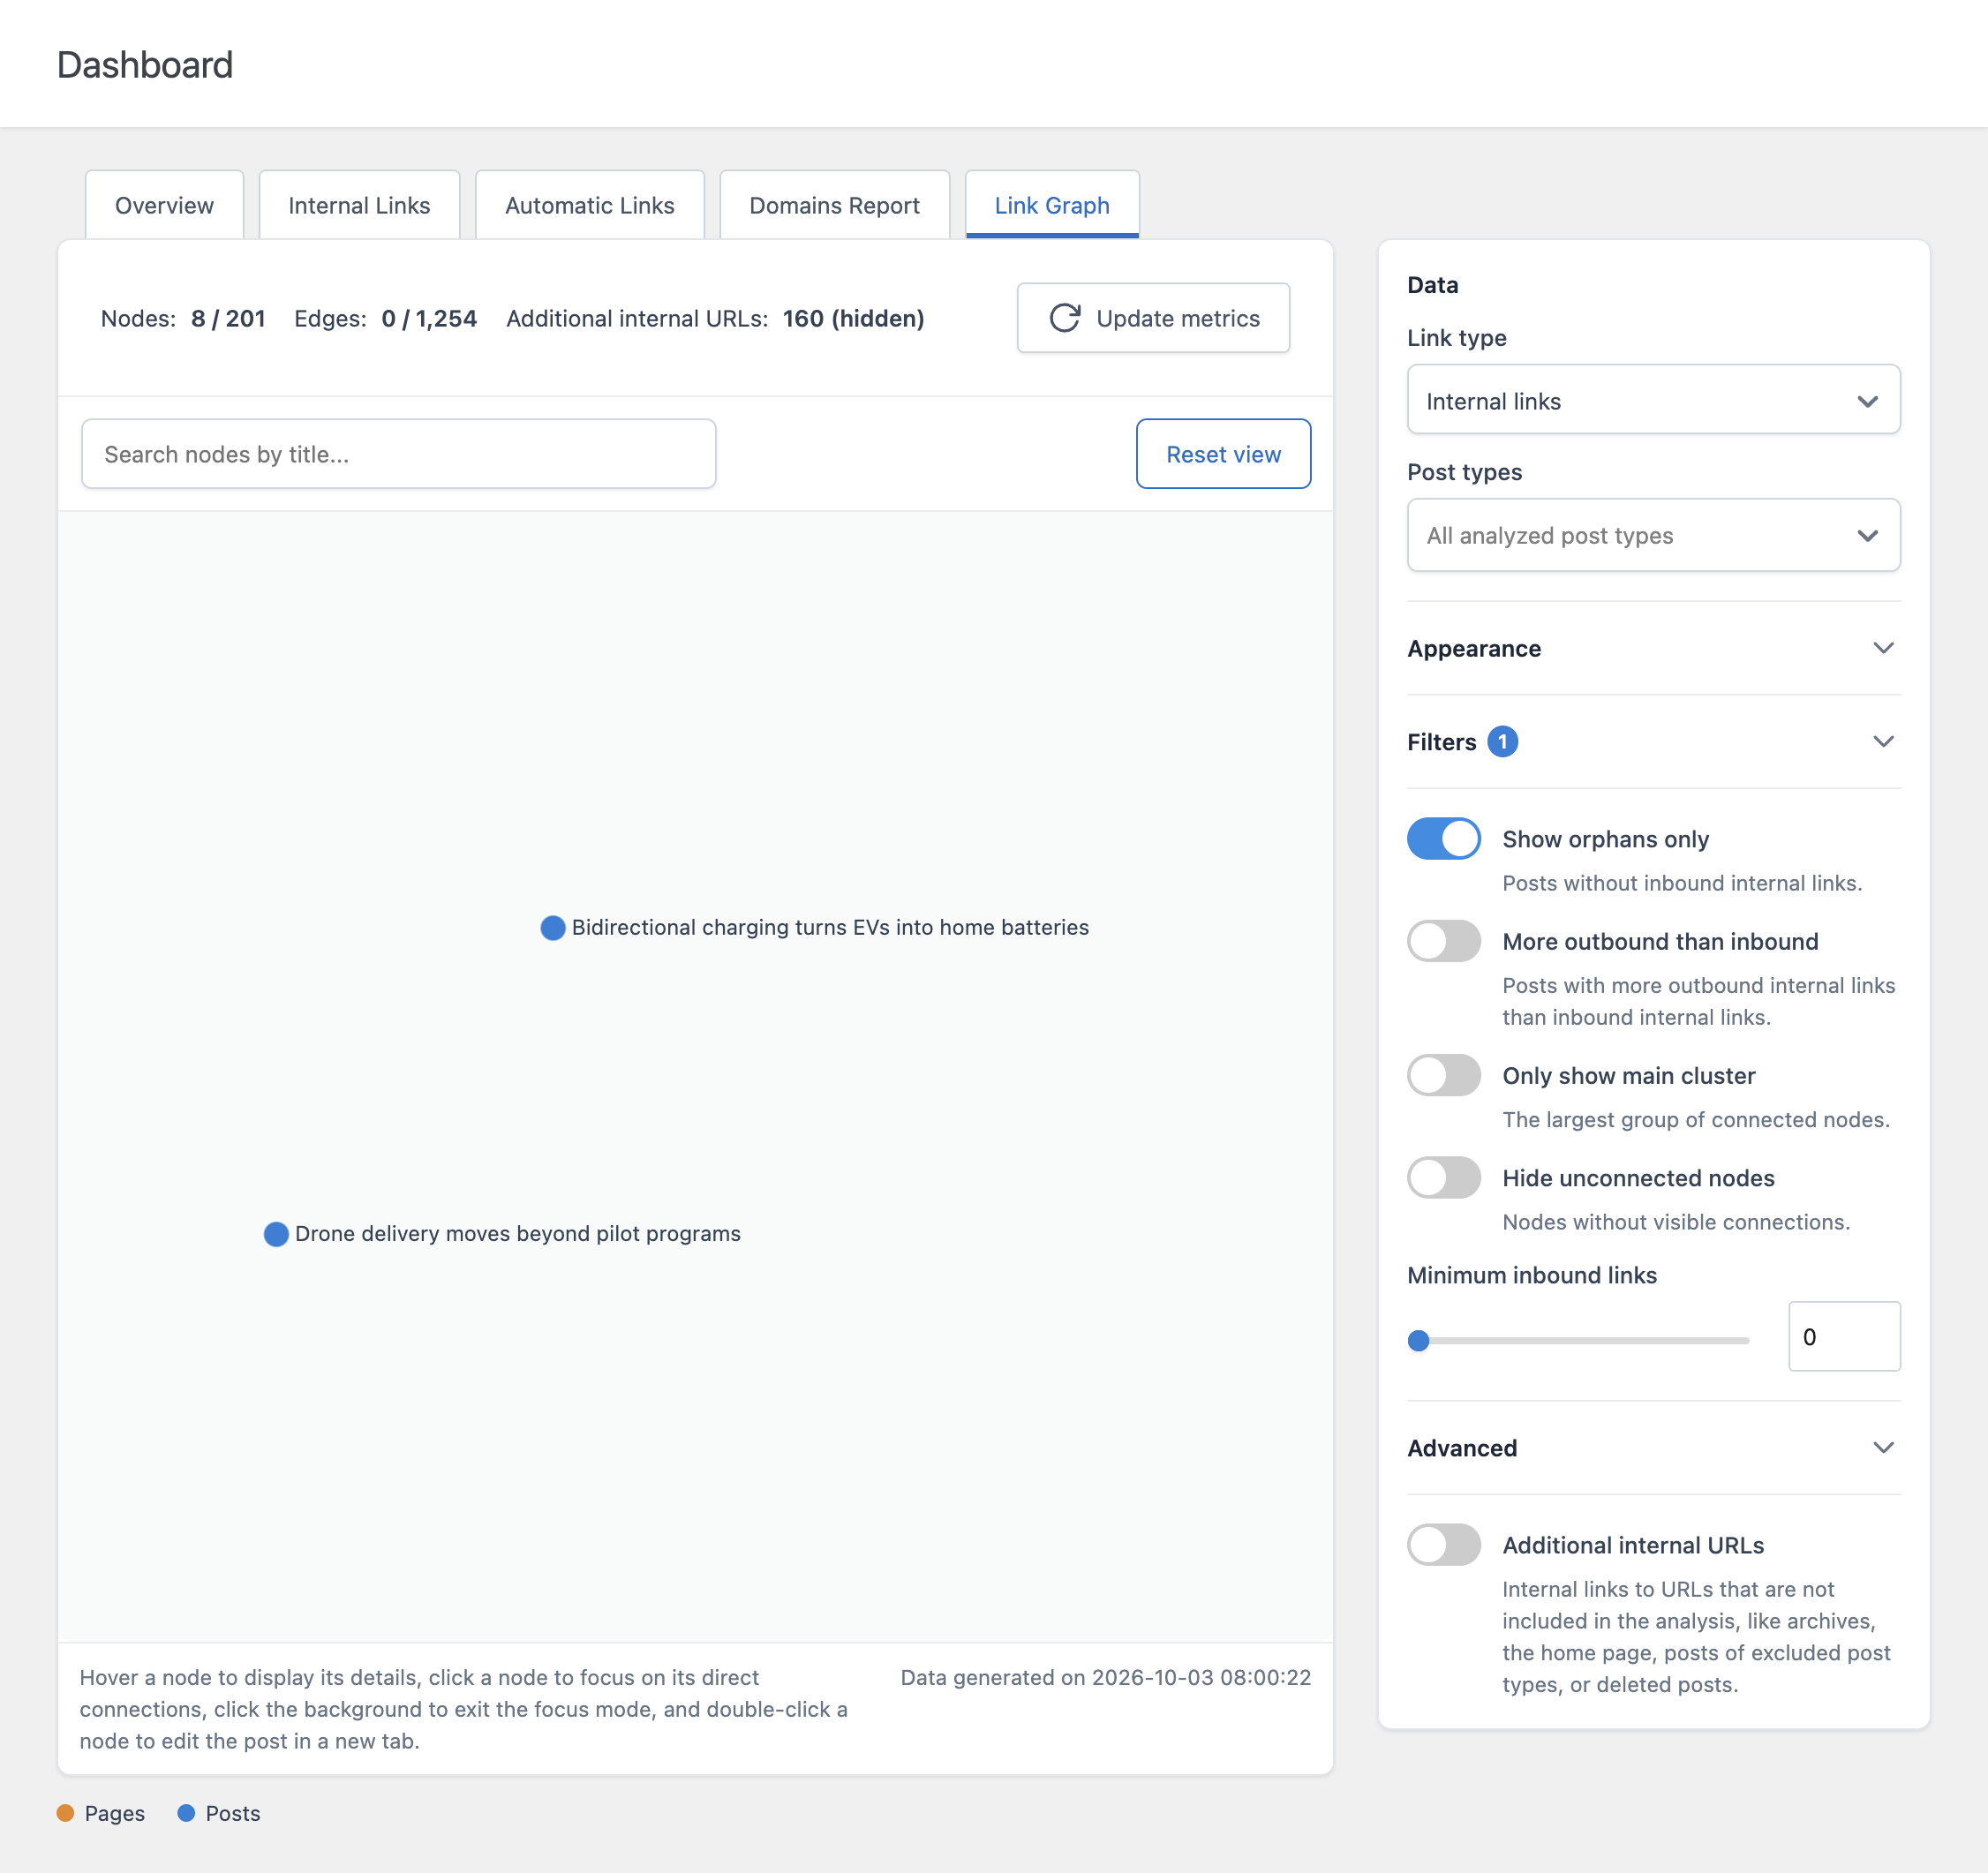
- Find orphan posts – Enable Show orphans only. These posts receive no internal links, so readers and search engines have no path to reach them from the rest of your site
- Identify your hubs – Keep Node size by set to Link equity. The largest nodes are the pages that receive the most link equity from your internal linking
- Spot isolated topics – Groups of nodes far from the center, or excluded by Only show main cluster, are content that is poorly connected to the rest of the site
- Find posts that give more than they receive – Enable More outbound than inbound to find posts that could benefit from more inbound links
- Review links to archives and removed content – Enable Additional internal URLs in the Advanced section to see which posts link to archives, the home page, or posts that no longer exist
Large Sites
To keep the graph responsive, the number of nodes is limited by the Link Graph Maximum Nodes option. When your site has more nodes than the limit, the graph displays the nodes with the highest link equity, and a notice reports how many nodes are displayed out of the total.
Settings
The Link Graph is controlled by two options in the Advanced section of the Settings menu, in the Link Graph card:
- Link Graph Maximum Nodes – The maximum number of nodes displayed in the Link Graph, from 100 to 20,000. The default value is 5,000. Higher values show more of your site but require more resources from the browser
- Link Graph Default Link Type – The link type selected when the Link Graph is opened: Internal Links Only, External Links Only, or Internal and External Links
The posts included in the graph are the posts included in the analysis of the Dashboard, as defined by the Dashboard Post Types and Limit Posts Analysis options. Refer to the dedicated documentation on Link Analysis settings for details.
The Link Graph is available to the users who can access the Dashboard menu, as defined by the Dashboard Menu capability. Refer to the dedicated documentation on capabilities for details.
Related Documentation
- Introduction to the Dashboard – the other tabs of the Dashboard menu
- Understanding Internal Links Statistics – the data used to build the graph, and how the optimization is calculated
- Understanding Link Equity – the metric used by default to size the nodes
- Domains Report: Outbound Link Distribution – the data used for the external domains